| Tweet | Follow @OphirGottlieb |  |  |

This visualization is provided by:
Capital Market Laboratories: Get Notified When CML Light Goes Live
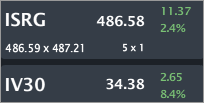
ISRG is trading $486.58, up 2.4% with IV30™ up 8.4%. The Symbol Summary is included below.
Provided by Livevol
Conclusion
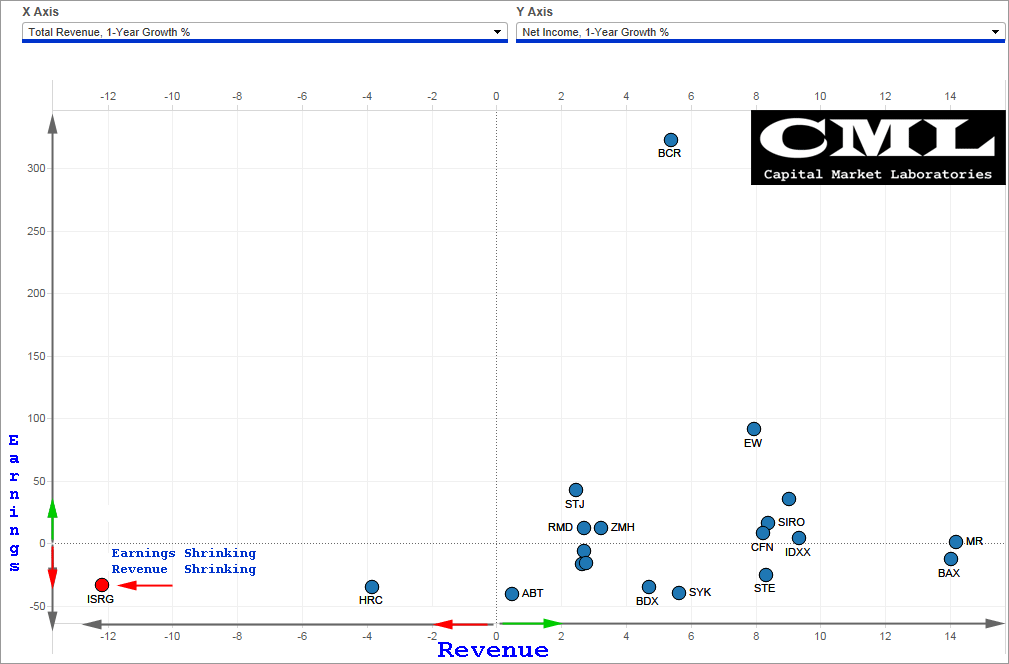
Relative to its peers, ISRG is doing quite well. It ranks near the top in gross margin % and earnings margin %. But if we take a look at trends, the company doesn't look alright... it doesn't look even close to alright. It looks... actually, it is... the worst. If the company can turnaround, the stock will too (probably), if not... well, then not.
We have Revenue Growth, 1-Year on the x-axis and Earnings, 1-Year Growth on the y-axis. The bottom left hand quadrant has one firm: ISRG.
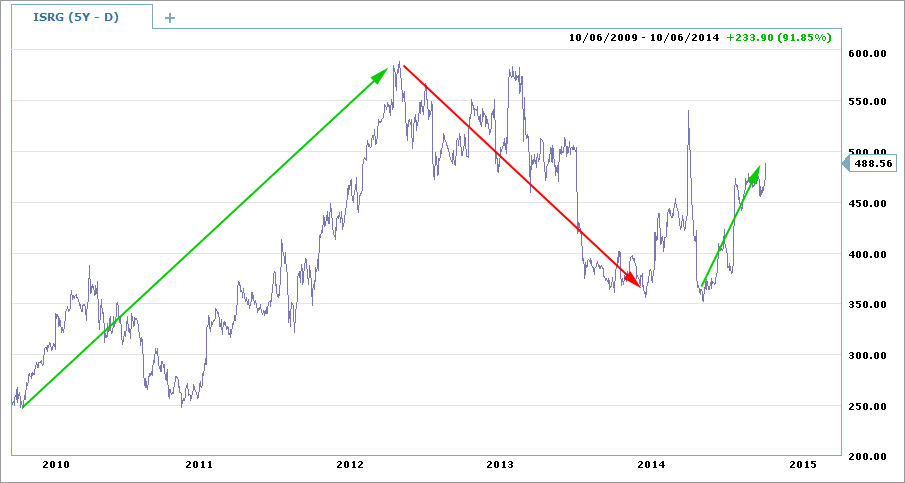
Let's turn to the stock chart for ISRG over a five-year period.
Provided by Charles Schwab optionsXpress
In totality, the stock is up 92%, but it hasn't been a straight line... really not even close. In the last two-years, ISRG stock is down ~6% while the S&P 500 is up ~33%.... But it's not all bad news. For 2014, YTD, ISRG is up 24% vs. the SPX up ~7%.
Let's focus on the financial measure visualizations, which are rather enlightening.
Total Revenue (TTM)
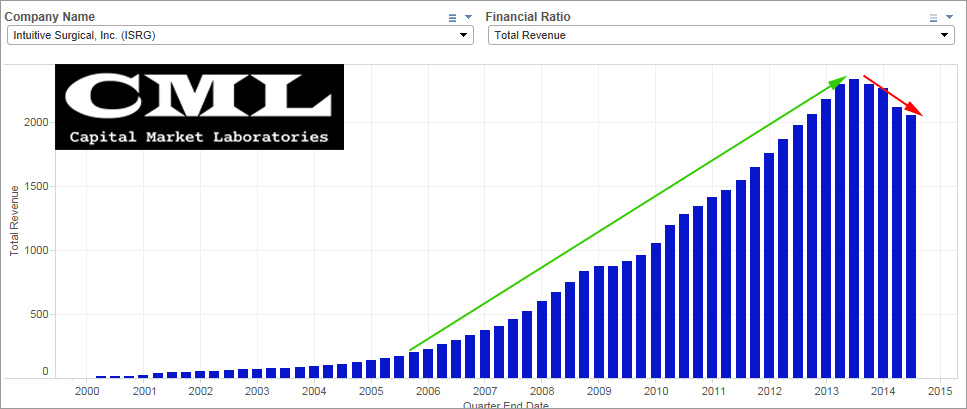
ISRG has seen huge revenue growth from below $200M to now over $2B (10x increase). but, the last several quarters have seen dips (when rolled up into trailing-twelve-month periods). It's that drop that has ISRG in the left hand side of that original chart at the top.
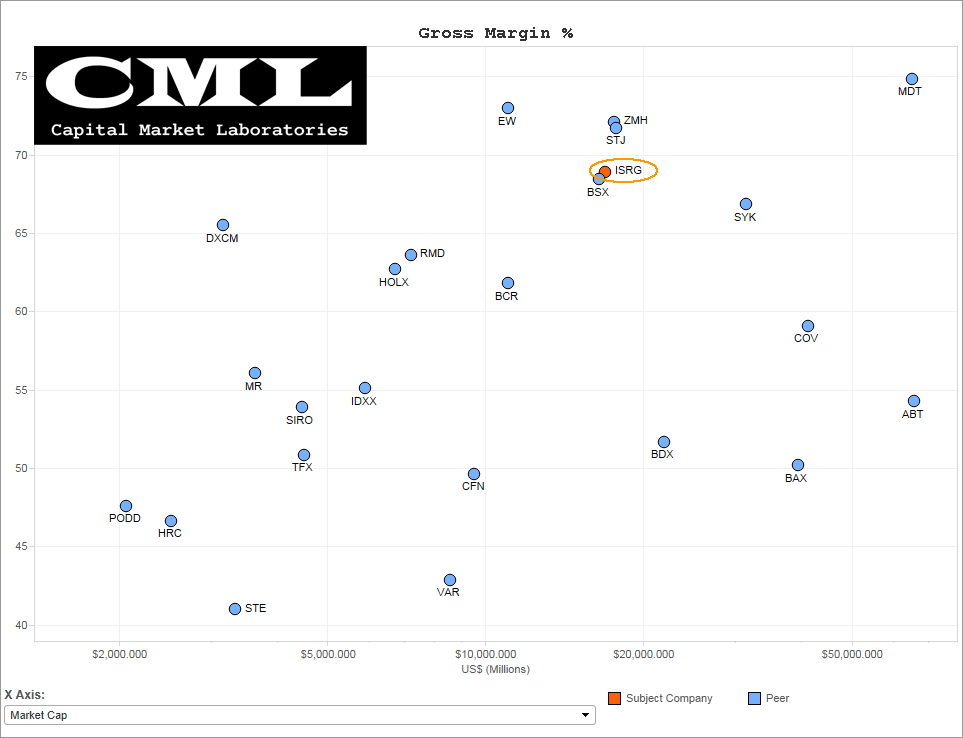
Gross Margin %
When compared to peers, ISRG has very nice gross margin %, hovering just below 70% (which is insane), and only outperformed by very few peers.
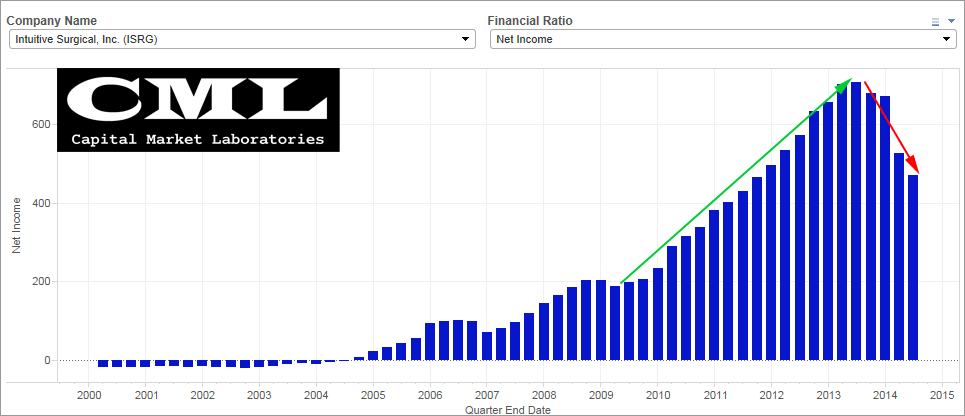
Net Income (TTM)
Though not pictured here, ISRG gross margin % has been slowly dipping... combine that with a drop in revenue, and yeah, you are gong to see earnings fall. The drop in annualized earnings for ISRG has been around 40%. It's this drop in net income that puts them n the lower half of the very first image and when combined with revenue shrinkage makes the firm look the worst on those two measures when combined.
Reprise: Earnings growth vs Revenue Growth
This is the same image as the first one... The bottom left hand corner is ISRG and now we know why:
* Revenue Dropping
* Earnings Dropping
And both are dropping faster than any other peer in the last year.

We can now take a look at the option market and risk. Let's turn to the IV30™ chart in isolation, below.

Provided by Livevol
The implied volatility is the forward looking risk in the equity price as reflected by the option market (IV30™ looks forward exactly 30 calendar days).
In English, the red curve is the risk in future stock price movement. We can see that just recently ISRG vol (risk) has popped over 50%. Hmm...
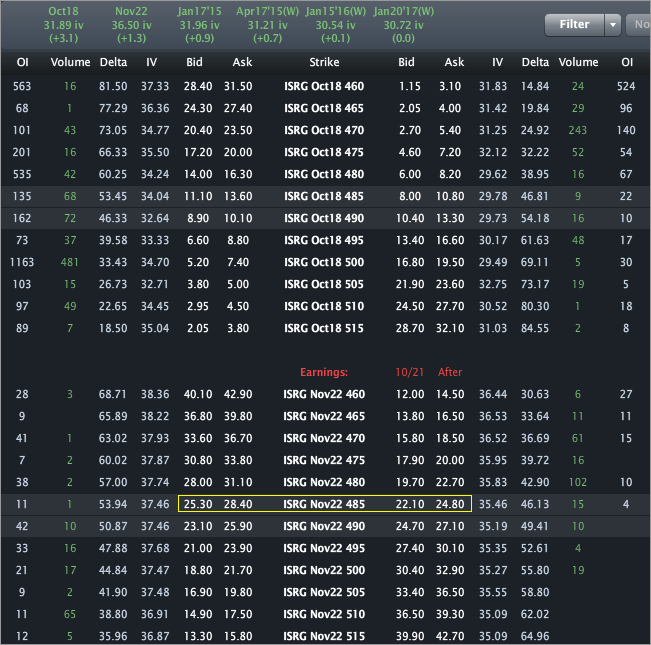
Finally, the Options Tab is included below.
Provided by Livevol
Using the at-the-money (ATM) straddle we can see that the option market reflects a price range of [$435, $535] (very roughly) by the end of trading on Nov 21st. Note that ISRG has an earnings release in the November options expiry, so that risk is embedded in the options.
- If you believe the stock will be outside that range on expiry or any date before then, then you think the volatility is too low.
- If you believe that range is too wide, and that the stock will definitively be in that range on expiration, then you think volatility is too high.
- If you're not sure, and can make an argument for either case, then you think volatility is priced just about right.
This is trade analysis, not a recommendation.
Follow @OphirGottlieb
Tweet
Legal Stuff:
Options involve risk. Prior to buying or selling an option, an investor must receive a copy of Characteristics and Risks of Standardized Options. Investors need a broker to trade options, and must meet suitability requirements.
The information contained on this site is provided for general informational purposes, as a convenience to the readers. The materials are not a substitute for obtaining professional advice from a qualified person, firm or corporation. Consult the appropriate professional advisor for more complete and current information. I am not engaged in rendering any legal or professional services by placing these general informational materials on this website.
I specifically disclaim any liability, whether based in contract, tort, strict liability or otherwise, for any direct, indirect, incidental, consequential, or special damages arising out of or in any way connected with access to or use of the site, even if I have been advised of the possibility of such damages, including liability in connection with mistakes or omissions in, or delays in transmission of, information to or from the user, interruptions in telecommunications connections to the site or viruses.
I make no representations or warranties about the accuracy or completeness of the information contained on this website. Any links provided to other server sites are offered as a matter of convenience and in no way are meant to imply that I endorse, sponsor, promote or am affiliated with the owners of or participants in those sites, or endorse any information contained on those sites, unless expressly stated.


No comments:
Post a Comment