| Tweet | Follow @OphirGottlieb |  |  |

This visualization is provided by:
Make These Visualizations Yourself: Free Trial
Original Post Date 10-31-2014
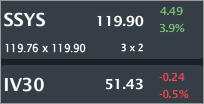
SSYS is trading $119.90, up 3.9% with IV30™ down 0.5%. The Symbol Summary is included below.
Provided by Livevol
Conclusion
SSYS is one of two giants in the 3-D printing arena and is reporting earnings on November 5th, after the market closes. There are some breathtaking trends occurring within the industry and the firm. We can see the explicit decision by management to forego earnings in the n ear-term to grow revenue (a lot). In fact, we will see a 200% rise in revenue corresponding with a 200% drop in earnings.
Further, we'll see that the risk as reflected by the option market is lower now than it has been in any of the seven prior earnings cycles. Combine that with some massive trends within the firm's financials and we have a compelling story to follow.
And... by the way, HP just announced ground breaking technological breakthroughs in 3-D printing two days ago (news is included below).
Here. We. Go.
------------------
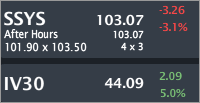
Update: 11-7-2014
Provided by Livevol
SSYS moved substantially more than the option market reflected.
Updated Option Prices
The at-the-money (ATM) straddle at the time of original publication was the $120 strike. That straddle is now worth $17. It was worth $10 at the time of original publication (see rest of article, below). That's a 70% mis-pricing.
------------------
Disclosure: I am long SSYS in my personal account.
News
----
Hewlett-Packard on Wednesday said it had developed 3D-printing technology that can print 10 times faster at considerably less expense than current products, and that it plans to launch the technology broadly in 2016.
Shares of Stratasys have slipped some 3 percent since the announcement, while those of rival 3D Systems Corp have dropped about 5 percent.
Source: Reueters via Yahoo! Finance Stratasys sees robust 3D-printing market as HP reveals plans, written by Lewis Krauskopf.
----
Let's start with the stock return chart.

Provided by Livevol
We can see over the last two-years that SSYS is up just under 80%, but in the one-year period it's up just 6%. More to the point, we can see that SSYS still moves very much like a "MOMO," swinging abruptly in one direction for a period of time and then completely reversing that trend and swinging equally (or more) abruptly in the other.
Let's turn to the financial measures.
Market Cap and Revenue
As a first step, we can see that there are two giants in the industry (in North America), both by revenue and market cap: DDD and SSYS.
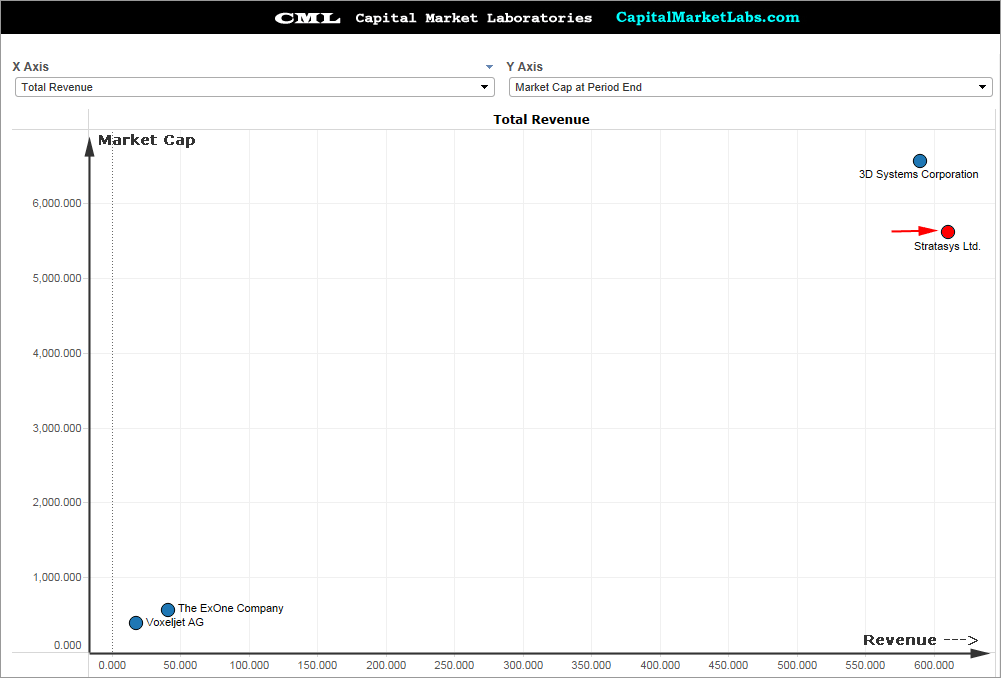
Let's focus on SSYS.
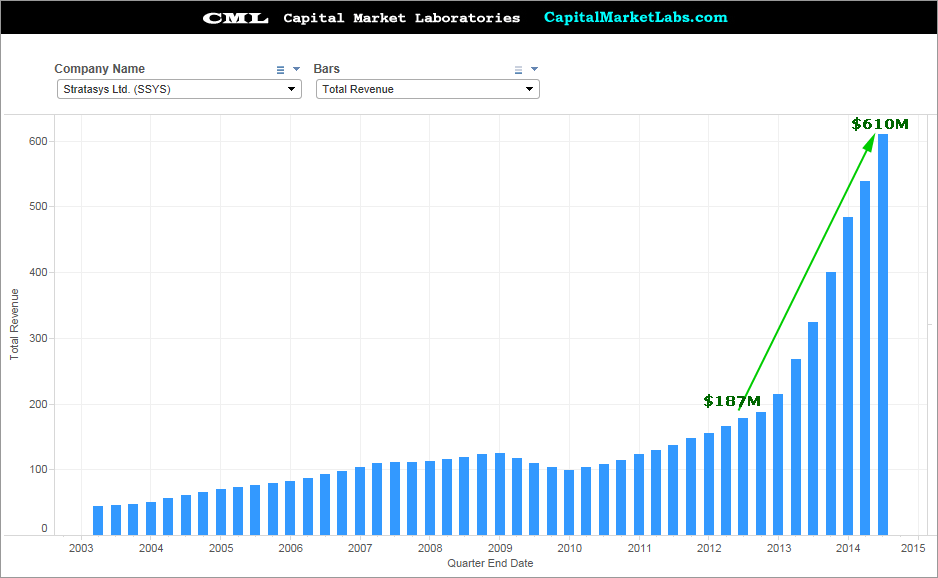
Revenue (TTM)
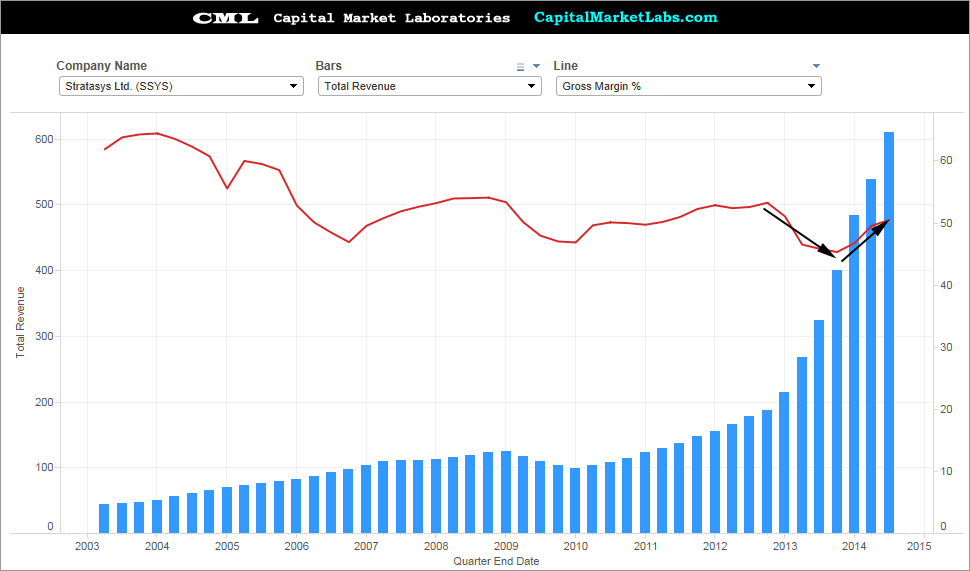
The revenue growth overall has been impressive but in the last two-years, it's been beyond impressive and closer to ridiculous. The firm has grown from $187M in revenue (TTM) to now over $600M (TTM).
Revenue vs. Gross Margin %
The first think i check when revenue is growing this quickly is the margins -- in this case, gross margin 5. We can see a dip in the gross margin and then a recent rise. Broadly speaking, SSYS has shown some shrinkage in gross margin % as prices have come down and they have entered some lower margin product lines.
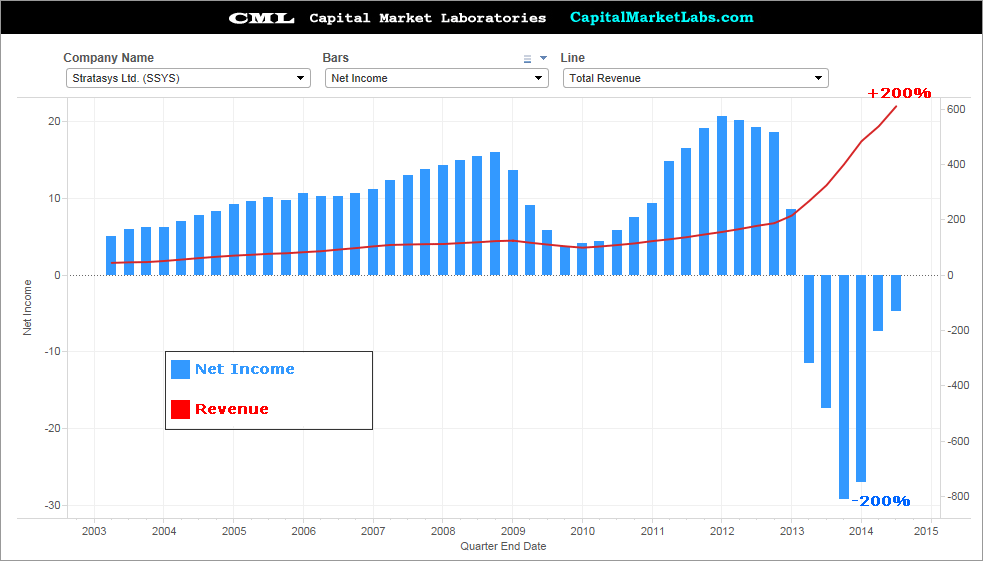
Revenue (TTM) vs. Net Income (TTM)
This is a fantastic chart in that it so clearly demonstrates the trade-off management has made between short-term quarterly profits and longer term revenue growth. The two have grown (shrunk) in perfect harmony. Revenue is up 200% while Net Income is down 200%.
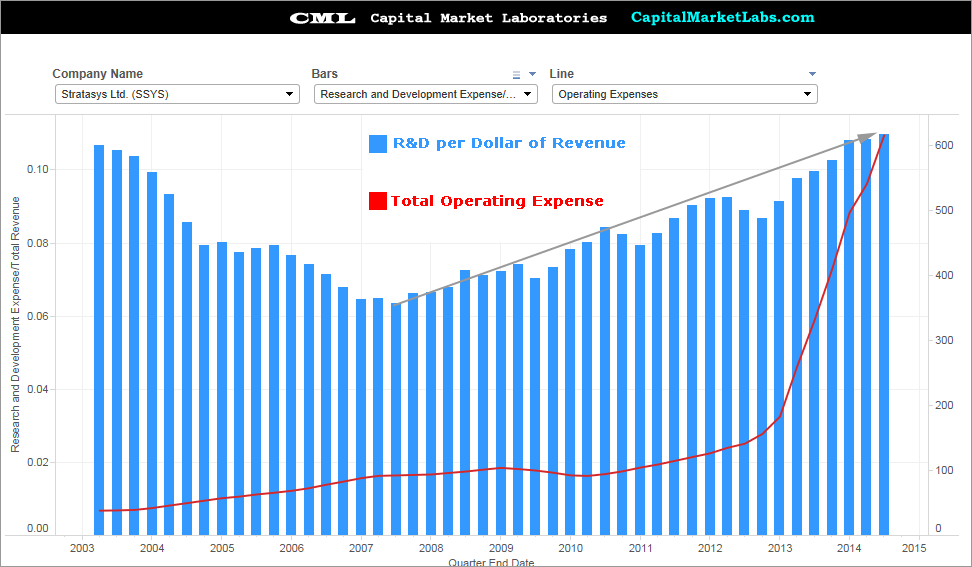
R&D per Dollar of Revenue vs. Operating Expense
As a firm grows, it's going to increase revenue and of course, expenses. The red line shows the rapid increase in operating costs for SSYS, very much like the increase in revenue... but at a substantially faster rate.
A part of that operating expense lies in research & development (R&D). The blue bars illustrate R&D expense per dollar of revenue, which has risen from $0.06 to now $0.11. In English, even as revenue rises, R&D spend per dollar of that revenue is up 50%. make no mistake, SSYS is still investing large amounts of capital in R&D and that investment is increasing rapidly.
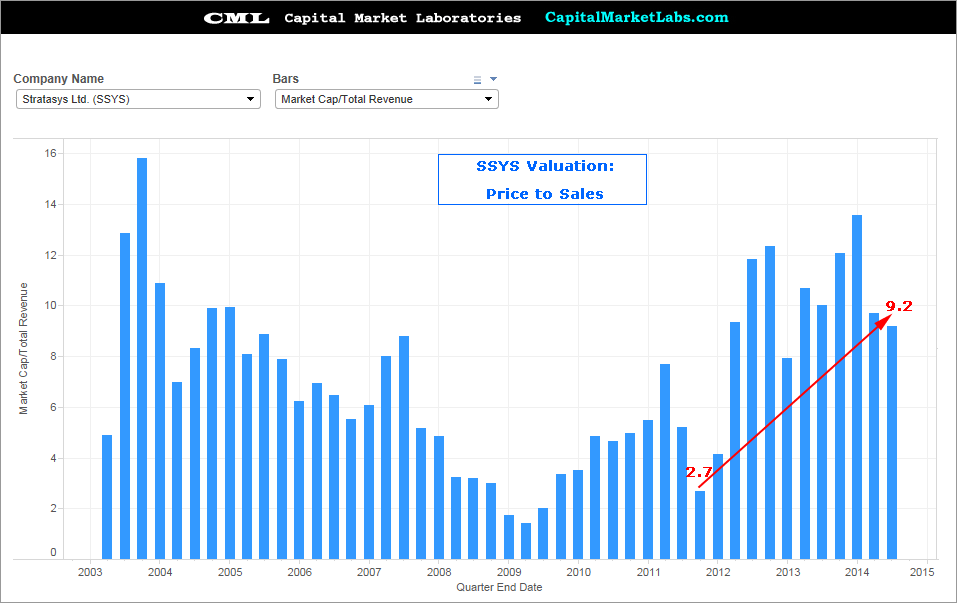
Valuation: Price to Sales
We can see that SSYS has had a higher price to sales in the past, but, the trend over the last two-years has seen it rise from ~3 to now around 9. This reflects an expected acceleration in SSYS growth -- either earnings, revenue, or both. A higher valuation presents greater risk in the stock price as well -- it means more of the market cap is based on achieving future goals. Don't lose track of this risk into earnings; expectations are very high.
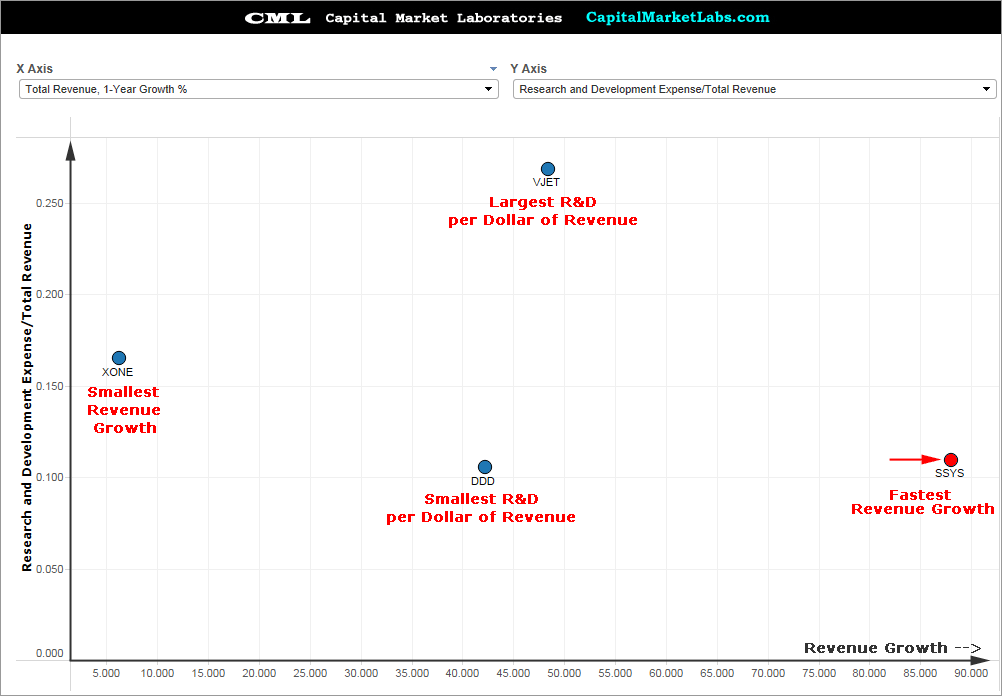
Revenue Growth vs. R&D
When charting R&D on the y-axis and one-year revenue growth on the x-axis, we can see that SSYS is growing revenue faster than the other three peers. We can also see that while the firm is expanding spending in R&D, it's still very much in line with its closest peer (DDD).
What to Watch
Wall St. has been willing to let net income slip, but only in the face of booming revenue growth. Four things to watch during the earnings release:
* Revenue Growth vs. Expectations.
* Revenue Growth Company forecasts vs. expectations.
--- Those first two are huge given the firm's price to sales expansion.
* Comments surrounding HP's announcement of a better/faster/cheaper technology
--- The timeline is 2016, SSYS better have something to say about that before that timeline hits.
* Data surrounding the over $10,000 and sub $10,000 3-D printing space, both of which SSYS participates in.
* Gross Margin % -- this better not fall much lower.
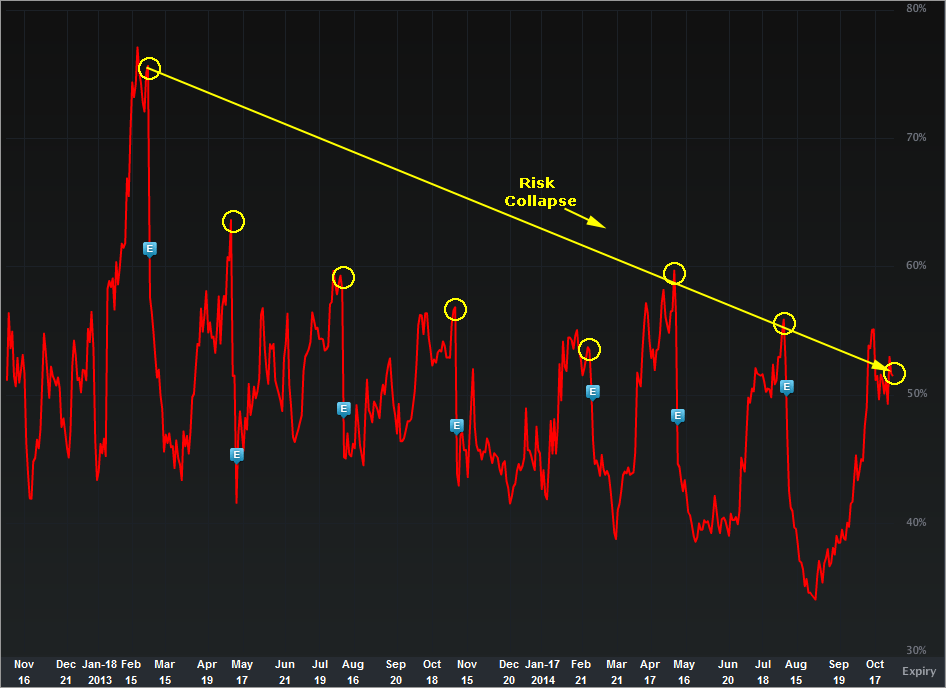
Finally, let's turn to the risk as reflected y the option market and the IV30™ chart.
Provided by Livevol
The implied volatility is the forward looking risk in the equity price as reflected by the option market (IV30™ looks forward exactly 30 calendar days).
In English, the red curve is the risk in future stock price movement. the blue "E" icons represent earnings dates and we can see now that SSYS has lower risk in the stock price as reflected by the option market than any of the prior seven earnings releases. That's a little weird given the expanding price to sales ratio.
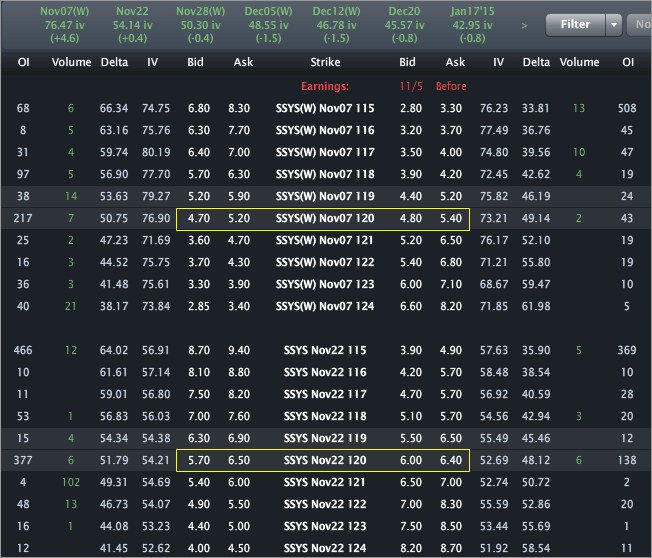
Finally, the Options Tab is included below.
Provided by Livevol
Using the at-the-money (ATM) straddle we can see that the option market reflects a price range of [$110, $130] by the end of trading on Nov. 7th.
That same range is [$108, $132] by the end of trading on Nov 21st.
- If you believe the stock will be outside that range on expiry or any date before then, then you think the volatility is too low.
- If you believe that range is too wide, and that the stock will definitively be in that range on expiration, then you think volatility is too high.
- If you're not sure, and can make an argument for either case, then you think volatility is priced just about right.
This is trade analysis, not a recommendation.
Follow @OphirGottlieb
Tweet
Legal Stuff:
Options involve risk. Prior to buying or selling an option, an investor must receive a copy of Characteristics and Risks of Standardized Options. Investors need a broker to trade options, and must meet suitability requirements.
The information contained on this site is provided for general informational purposes, as a convenience to the readers. The materials are not a substitute for obtaining professional advice from a qualified person, firm or corporation. Consult the appropriate professional advisor for more complete and current information. I am not engaged in rendering any legal or professional services by placing these general informational materials on this website.
I specifically disclaim any liability, whether based in contract, tort, strict liability or otherwise, for any direct, indirect, incidental, consequential, or special damages arising out of or in any way connected with access to or use of the site, even if I have been advised of the possibility of such damages, including liability in connection with mistakes or omissions in, or delays in transmission of, information to or from the user, interruptions in telecommunications connections to the site or viruses.
I make no representations or warranties about the accuracy or completeness of the information contained on this website. Any links provided to other server sites are offered as a matter of convenience and in no way are meant to imply that I endorse, sponsor, promote or am affiliated with the owners of or participants in those sites, or endorse any information contained on those sites, unless expressly stated.


No comments:
Post a Comment