| Tweet | Follow @OphirGottlieb |  |  |
This article was originally published on October 21st.

This visualization is provided by:
Make These Visualizations Yourself: Free Trial
TWTR is trading $51.29, up 1.2% with IV30™ up 0.1%. The Symbol Summary is included below.

Provided by Livevol
Conclusion
Twitter is the only pure play R&D bet in all of Internet Software & Services... and I mean, by a huge amount.
TWTR is growing revenue faster than any other peer.
TWTR has worse net income margins than any other peer.
TWTR net income has dropped 900% since going public.
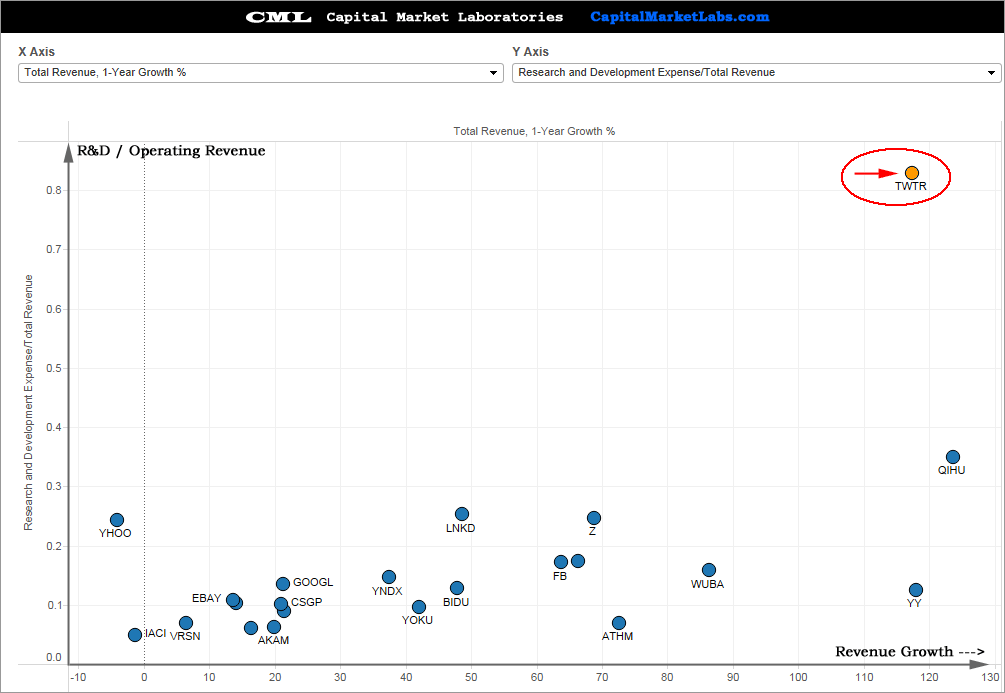
TWTR is investing in Research & Development (R&D) more than any other peer.
TWTR is growing the investment in R&D faster than any other peer.
TWTR has earnings due out on 10-27-2014 after the market closes. It's time to really understand what's going on with this firm, and it goes way beyond the social media and click bait articles. You want to know the bet on TWTR, clearer than any investment bank will make for you? Give it three minutes, by the time you're done with this you'll be the one with the knowledge... and that means you'll be the one with the power.
Something You Should Know, But I Won't Discuss
TWTR has given guidance of 14-17 million monthly average user growth (MAUs). Outside forecasts are calling for 18 million.
There is some concern that the World Cup skewed results from last quarter and may have inflated growth forecasts for this quarter.
TWTR is projected to produce an operating profit (yeah, earnings), excluding one-time events.
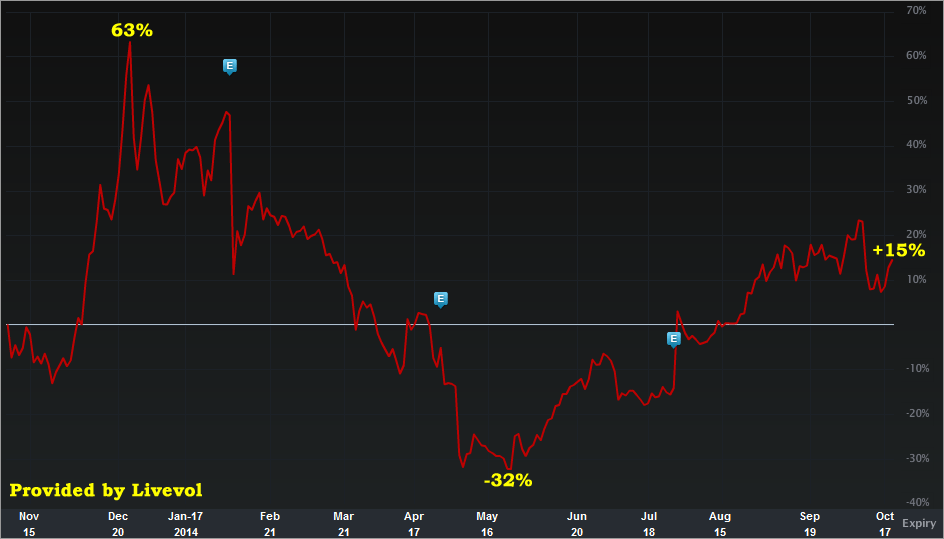
Let's start with the stock price return chart.
Provided by Livevol
For all the hoopla, TWTR stock is up ~15% since going public and an opening print of $45.10 (closing print of $44.90). The stock has seen an epic peak, and epic drop and now a slow but consistent recovery.
The real question is: "What is this business?... this Twitter?
Here. We. Go.
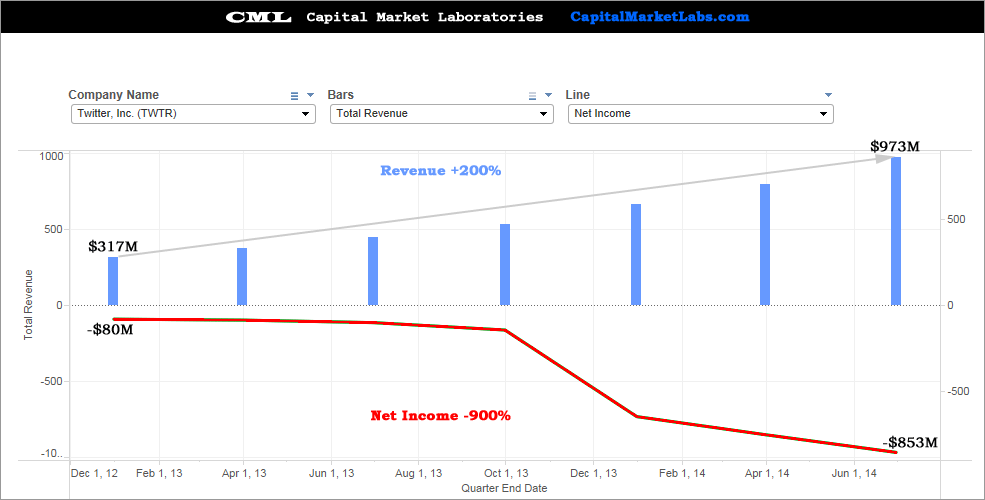
Revenue (TTM) vs. Net Income (TTM)
The blue bars chart the trend in revenue and we can see TWTR has grown from $317M to $973M in the trailing twelve months, or a 200%+ rise in revenue.
The red line chart the net income. We can see the firm has gone from an $80M loss, to now an $853M loss, or a 900% decline. That red line dipped exactly as TWTR more than doubled down on R&D expense (see charts below).
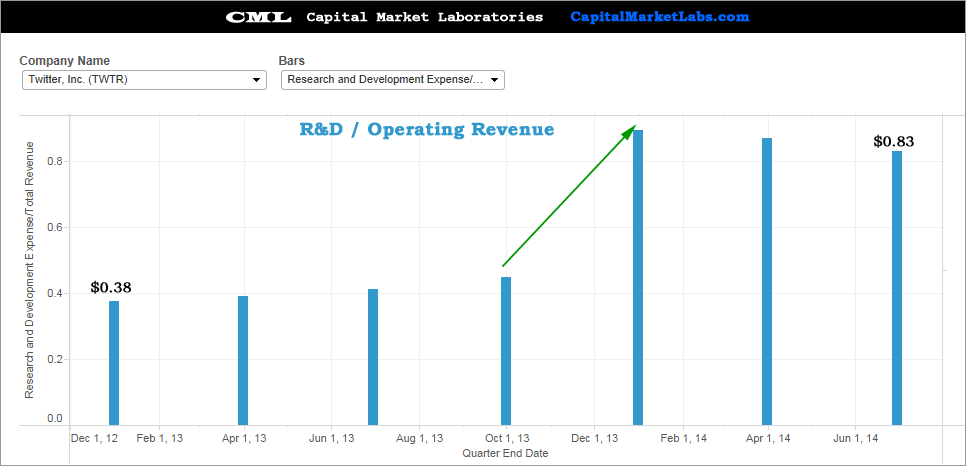
Research & Development per Dollar of Revenue
TWTR has drastically changed its mode of operation. The firm was spending $0.38 of every dollar in revenue on research and development (R&D). Now the firm spends $0.83 for every dollar of revenue, and that includes the fact that revenue itself has risen more than 200%. That is an enormous rise in R&D.
Do This Yourself: Capital Market Laboratories
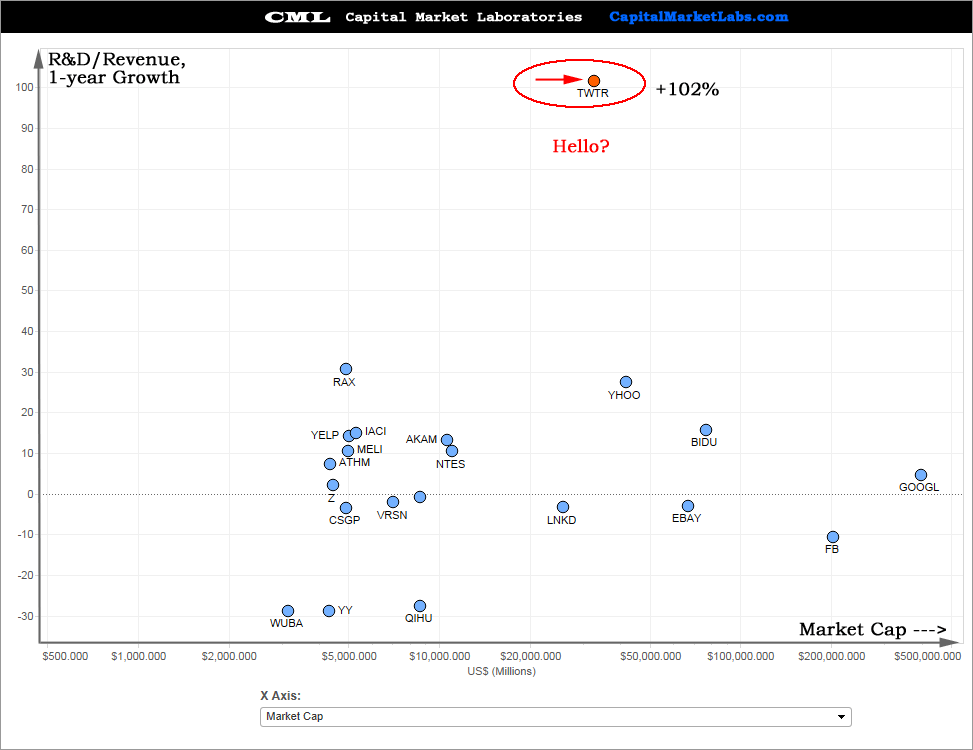
R&D, 1-Year Growth
A fair question to ask is whether the increase in R&D expenditures for TWTR (relative to revenue) is similar to peers. Well... no, it isn't. The y-axis plots R&D, 1-Year Growth, the x-axis plots market cap. We can see rather plainly... There's TWTR, and then there's everybody else. The firm has increased spending on R&D per dollar of revenue by 102% in the trailing twelve months.
R&D vs. Revenue Growth
It really takes this chart to digest the prior information. The x-axis plots R&D per dollar of revenue, the y-axis plots revenue growth (1-year). We can see when it comes to these two measures, there's TWTR, and then there's everybody else.
Do This Yourself: Capital Market Laboratories
Now we can see rather plainly, the "bet" on TWTR -- long or short; bull or bear... depends simply on this: Will TWTR be able to turn that R&D expense into earnings? Revenue is booming up; Earnings are booming down.
Gross Margin %
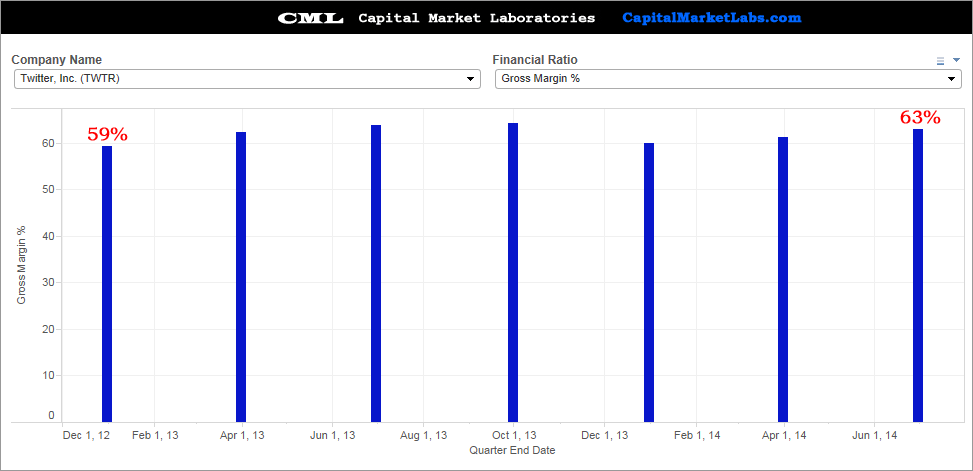
perhaps the most enticing part of the Internet Software & Services Industry is the enormous gross margin % the firms generate. It's absolutely critical to watch that margin as revenues grow. TWTR has grown revenue from ~$300M to ~$1B and in that time has not only maintained gross margin %, but has grown it from 59% to 63%. This is a hugely bullish signal.
Operating Revenue / Operating Expense
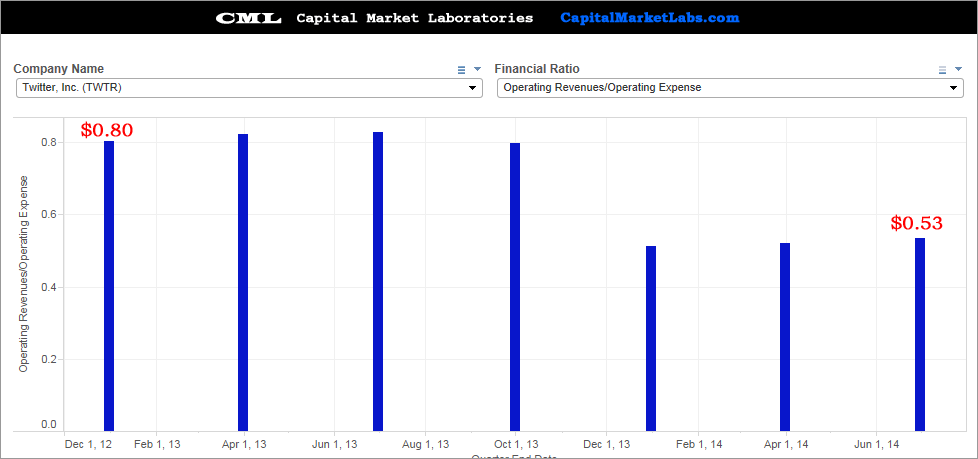
One of my favorite measures of all and perhaps the single most important is comparing operating revenue to operating expenses. Obviously a firm must have more than $1 in Op.Rev for every dollar in Op. Ex to be profitable.
TWTR has gone from paying $1 in expenses to generate $0.80 in revenue to now paying that same dollar for just $0.53 in revenue. Both of those numbers are very bad. The trend is awful. While gross margin % was bullish for TWTR, this is a hugely bearish measure for TWTR.
When it all comes down to it, after the firm reports revenue and net income, user growth and ad growth, monthly users and interactivity, and everything else, it's this number, this measure, that could define everything. If TWTR reports strong top line (aka revenue) growth and this measure creeps up above 1, the stock could explode up. Alternatively, if the firm reports strong revenue but margin deteriorate even further, the stock could collapse.
Do This Yourself: Capital Market Laboratories
Price to Sales
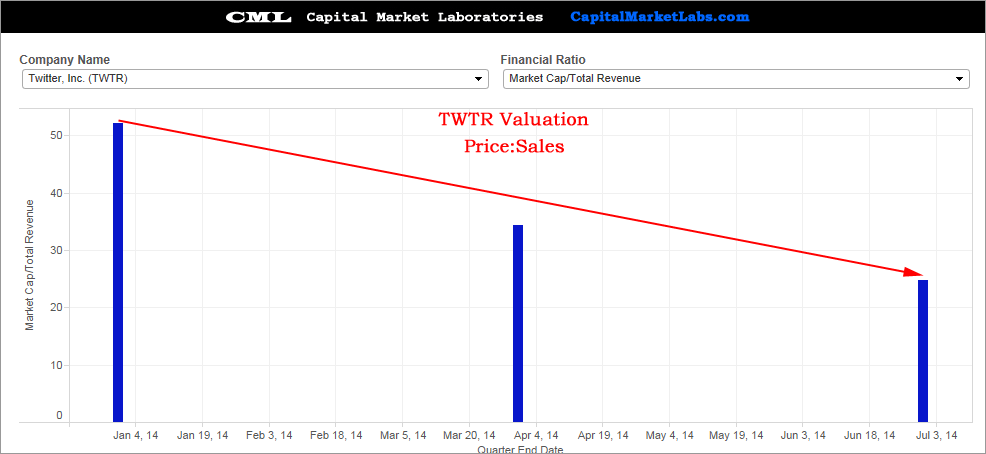
The equity market has fallen out of love with TWTR, and by that I mean it is pricing the stock at a lower valuation than before. For every dollar of sales, the equity market is pricing the stock ~30x that. When it went public that number was closer to 50x. This is quite different than NFLX, which before the crash was trading at an all-time high in Price/Sales.
There is less pressure on TWTR to deliver "perfection" in earnings. No, a P/S of 30 is still huge, but it ain't 50...
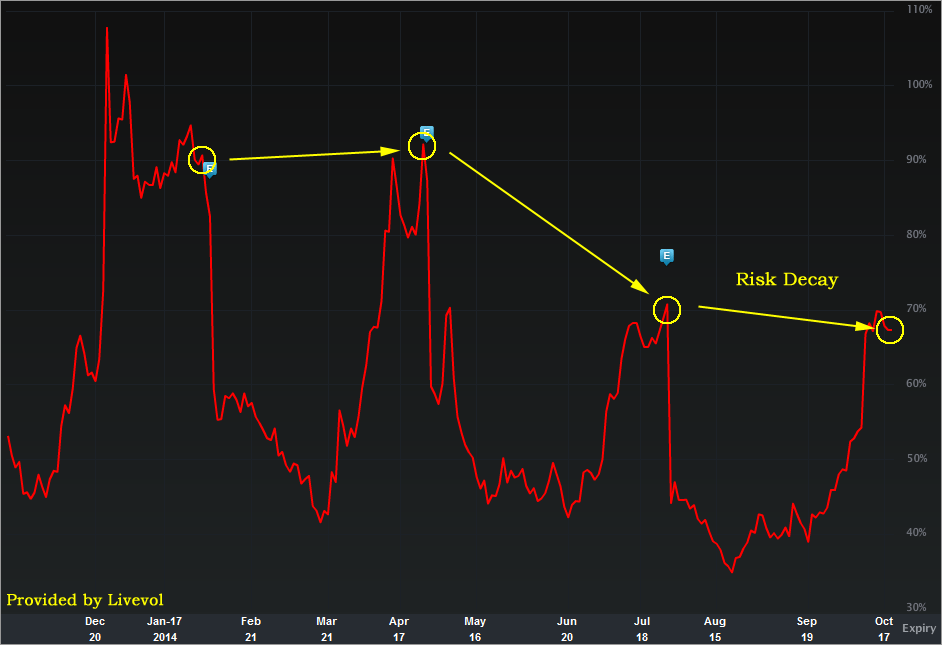
Let's turn to the IV30™ chart in isolation, below.
Provided by Livevol
The implied volatility is the forward looking risk in the equity price as reflected by the option market (IV30™ looks forward exactly 30 calendar days).
In English, the red curve is the risk in future stock price movement. The blue "E" icons represent earnings cycles.
We can see the slow decay in risk as priced by the option market. That actually makes sense for a company after it goes public. The more earnings releases the market sees, the less risk there is of a bombastic surprise.
But... Should this earnings release for TWTR really show the lowest risk than any other? I dunno, the option market reads: "yes."
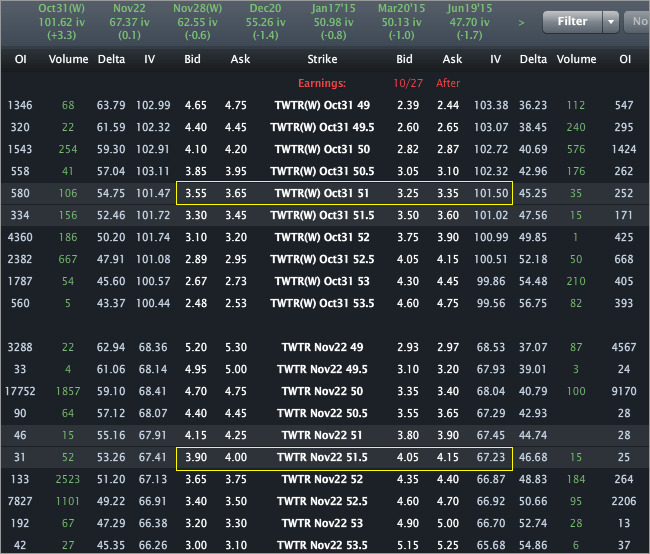
Finally, the Options Tab is included below.
Provided by Livevol
Using the at-the-money (ATM) straddle we can see that the option market reflects a price range of [$44, $58] by the end of trading on Oct31st.
Using the Nov options we see a price range of [$43.50, 59.50].
I'm not making a recommendation at all, nor do i ever... But... The Nov straddle is only $1 more than the Oct31 weekly straddle... Huh?
- If you believe the stock will be outside that range on expiry or any date before then, then you think the volatility is too low.
- If you believe that range is too wide, and that the stock will definitively be in that range on expiration, then you think volatility is too high.
- If you're not sure, and can make an argument for either case, then you think volatility is priced just about right.
This is trade analysis, not a recommendation.
Follow @OphirGottlieb
Tweet
Legal Stuff:
Options involve risk. Prior to buying or selling an option, an investor must receive a copy of Characteristics and Risks of Standardized Options. Investors need a broker to trade options, and must meet suitability requirements.
The information contained on this site is provided for general informational purposes, as a convenience to the readers. The materials are not a substitute for obtaining professional advice from a qualified person, firm or corporation. Consult the appropriate professional advisor for more complete and current information. I am not engaged in rendering any legal or professional services by placing these general informational materials on this website.
I specifically disclaim any liability, whether based in contract, tort, strict liability or otherwise, for any direct, indirect, incidental, consequential, or special damages arising out of or in any way connected with access to or use of the site, even if I have been advised of the possibility of such damages, including liability in connection with mistakes or omissions in, or delays in transmission of, information to or from the user, interruptions in telecommunications connections to the site or viruses.
I make no representations or warranties about the accuracy or completeness of the information contained on this website. Any links provided to other server sites are offered as a matter of convenience and in no way are meant to imply that I endorse, sponsor, promote or am affiliated with the owners of or participants in those sites, or endorse any information contained on those sites, unless expressly stated.


I like your article but I still feel that TWTR may go up this ER as it has not only got upgrades from analysts, it also has fared well in the past quarter. I think it will post improved performance in this quarter as well.
ReplyDeleteAnalyst are always right, so forget this detailed analysis and supporting data. -ChrisE
ReplyDeleteThis is one awesome updated article about Twitter (TWTR) - Earnings Preview: The trends that define absolutely averything.
ReplyDelete