| Tweet | Follow @OphirGottlieb |  |  |

This visualization is provided by:
Capital Market Laboratories: Free Trial
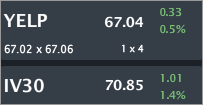
YELP is trading $67.04, up small with IV30™ up 1.4%%. The Symbol Summary is included below.
Provided by Livevol
Conclusion
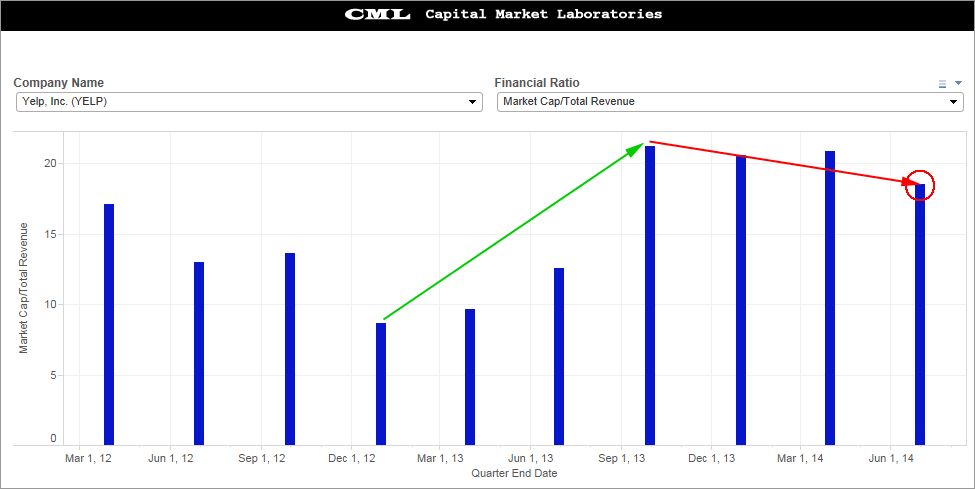
YELP stock moves like a MOMO... it lives and breathes like a MOMO. It has booming revenue, incredibly high gross margin% and... losses for the trailing-twelve-months, but a first time ever quarterly profit last quarter. The price:sales ratio took a massive jump up from 2012 to 2013 reflecting accelerating growth expectations, but that trend has cooled off (a little bit) into the present.
With this next earnings report there are risks surrounding not just the bottom (net income) and top line (revenue), but also forecasts moving forward, Much like NFLX, it's the growth forecasts that could have a violent impact on the stock (up or down). Let's take a deeper dive...
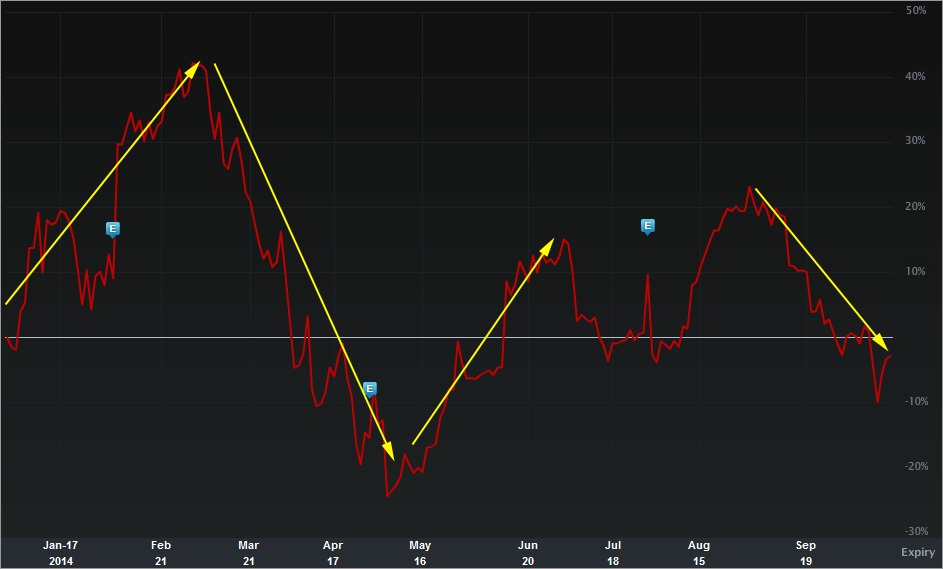
The YTD stock price return chart is included below.
Provided by Livevol
This is exactly what a momentum stock looks like. It moves in abrupt and prolonged trends (i.e. momentum). The stock was up 40% in the first two-months of the year, dropped from that peak to a low of down 25%, then ripped back up... stood still for a second, then rose and now has fallen again to a negative YTD return. It's safe to say, in my opinion, the stock is not in equilibrium because the unknowns about the future have so many various and widely distributed outcomes.
Let''s look at the financial measures.
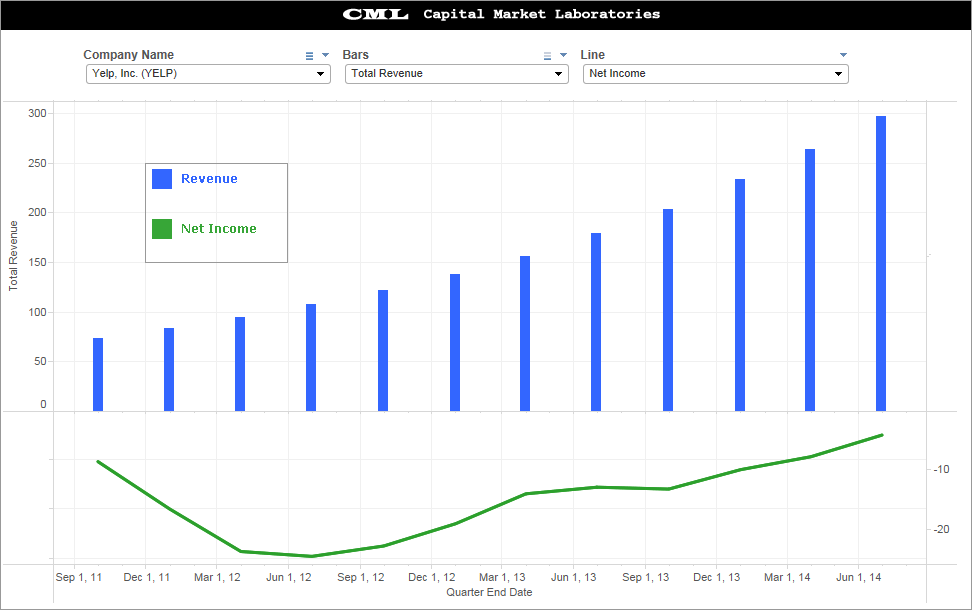
Revenue (TTM) vs. Net Income (TTM)
For YELP bulls, this chart says everything. Revenue is booming and at the same time losses have been shrinking to the point where last quarter, the firm reported a profit of $2.7 million.
Make These Visualizations Yourself: Free Trial
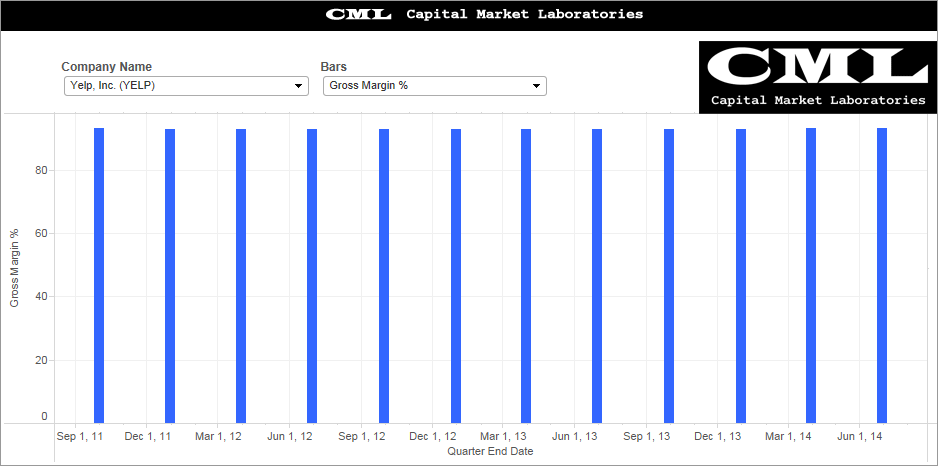
Gross Margin %
While this chart looks stagnant, it's in fact beautiful for YELP bulls. The firm has maintained 90% gross margins... forever. When a firm can grow revenue quickly and maintain gross margins, that's a very bullish sign.
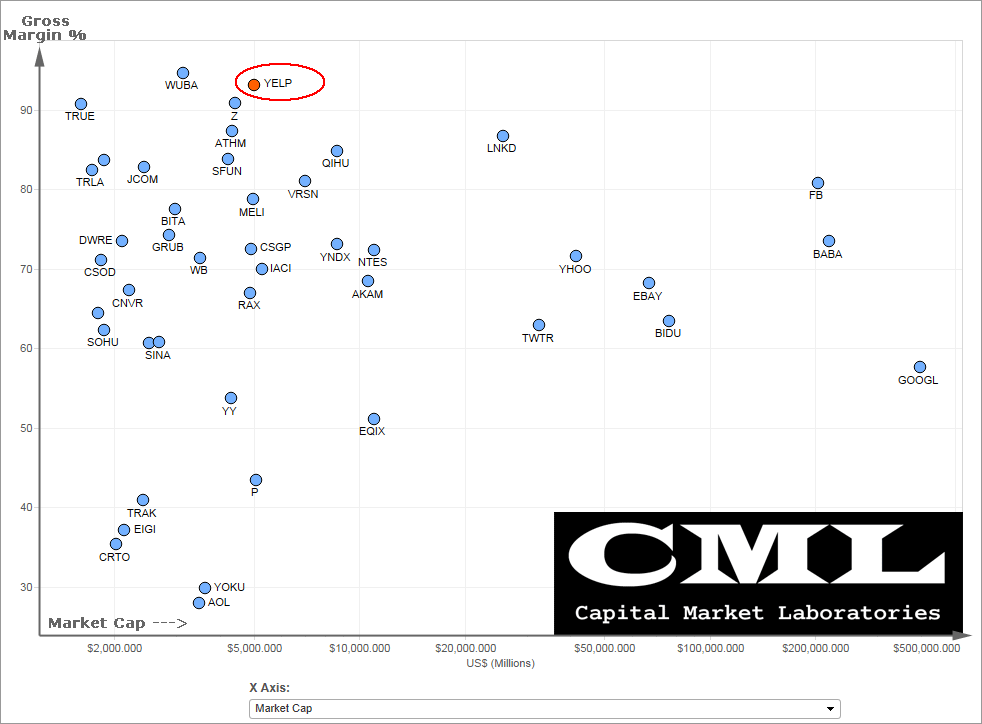
Gross Margin % vs. Peers
Just how high are YELP gross margins?... Well, in the Internet & Services Industry they are the second highest. A truly remarkable level of gross margins.
So it's all good news, right? Bullish as bullish can be? Not quite...
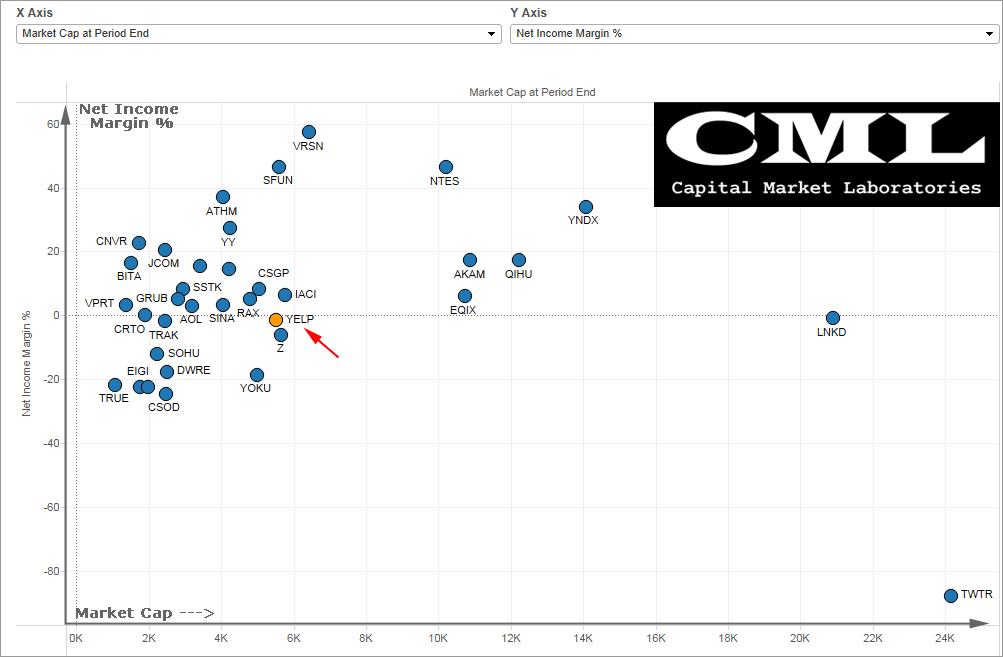
Net Income Margin % vs. Peers
We can see net income margin % (earnings margins) vs market cap, and the bottom line is YELP looks pretty bad. There are smaller companies in market cap in the same industry with substantially higher earnings margins.
Valuation: Price to Sales
This is where the risk lies... YELP saw a massive increase in its stock price and even more so, a rise in its price: sales valuation. The firm wen from ~8:1 to over 20:1 and now in the 17:1 range. While that peak in P/S has come down, YELP is still very much priced to very, very, very high expectations (just like NFLX was).
Make These Visualizations Yourself: Free Trial
If the firm beats those expectations, that multiple will push the stock much higher. if the firm misses expectations or warns of growth slowing, that multiple will collapse (like NFLX). Here lies the risk.
Let's turn to the IV30™ chart in isolation, below.
Provided by Livevol
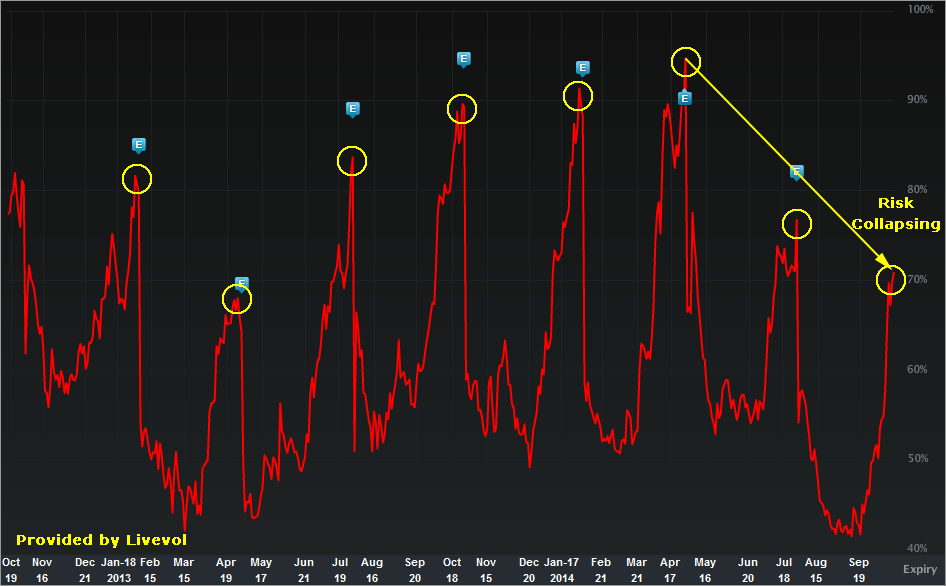
The implied volatility is the forward looking risk in the equity price as reflected by the option market (IV30™ looks forward exactly 30 calendar days).
In English, the red curve is the risk in future stock price movement. The blue "E" icons represent prior earnings releases. We can see a consistent downward trend in the risk into earnings as reflected by the option market and that trend continues now.
One note... YELP doesn't release earnings until 10-22-2014, so that red curve should elevate from the current level.
In any case, in my opinion the risk in the option market reflects a malaise that is simply not worthy of the risk in the stock or the overall market. This is a big event for YELP... not one, in my opinion, that has lower risk than seven of the prior eight earnings cycles.
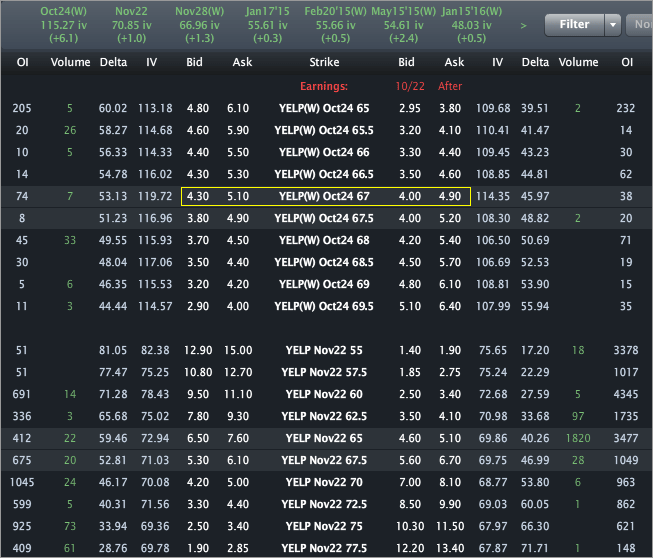
Finally, the Options Tab is included below.
Provided by Livevol
Using the at-the-money (ATM) straddle we can see that the option market reflects a price range of [$58, $78] by the end of trading on October 24th.
Going out to November expiry, that range is [$55.50, $79.50] by the end of trading on Nov. 21st. That one has my eye.
- If you believe the stock will be outside that range on expiry or any date before then, then you think the volatility is too low.
- If you believe that range is too wide, and that the stock will definitively be in that range on expiration, then you think volatility is too high.
- If you're not sure, and can make an argument for either case, then you think volatility is priced just about right.
This is trade analysis, not a recommendation.
Follow @OphirGottlieb
Tweet
Legal Stuff:
Options involve risk. Prior to buying or selling an option, an investor must receive a copy of Characteristics and Risks of Standardized Options. Investors need a broker to trade options, and must meet suitability requirements.
The information contained on this site is provided for general informational purposes, as a convenience to the readers. The materials are not a substitute for obtaining professional advice from a qualified person, firm or corporation. Consult the appropriate professional advisor for more complete and current information. I am not engaged in rendering any legal or professional services by placing these general informational materials on this website.
I specifically disclaim any liability, whether based in contract, tort, strict liability or otherwise, for any direct, indirect, incidental, consequential, or special damages arising out of or in any way connected with access to or use of the site, even if I have been advised of the possibility of such damages, including liability in connection with mistakes or omissions in, or delays in transmission of, information to or from the user, interruptions in telecommunications connections to the site or viruses.
I make no representations or warranties about the accuracy or completeness of the information contained on this website. Any links provided to other server sites are offered as a matter of convenience and in no way are meant to imply that I endorse, sponsor, promote or am affiliated with the owners of or participants in those sites, or endorse any information contained on those sites, unless expressly stated.


No comments:
Post a Comment