| Tweet | Follow @OphirGottlieb |  |  |

This visualization is provided by:
Make These Visualizations Yourself: Free Trial
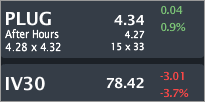
PLUG closed trading at $4.34, up small with IV30™ down 3.1%. The Symbol Summary is included below.
Provided by Livevol
Conclusion
This isn't quite an earnings preview, it's a company "get to know." There are a lot of moving parts to this firm, including a CEO with a panache for headline grabbing, growing revenue, collapsing investment in R&D, negative but growing gross margin % and one other measure that is absolutely booming (good news) but is still very (very) low (bad news).
Let's learn about PLUG.
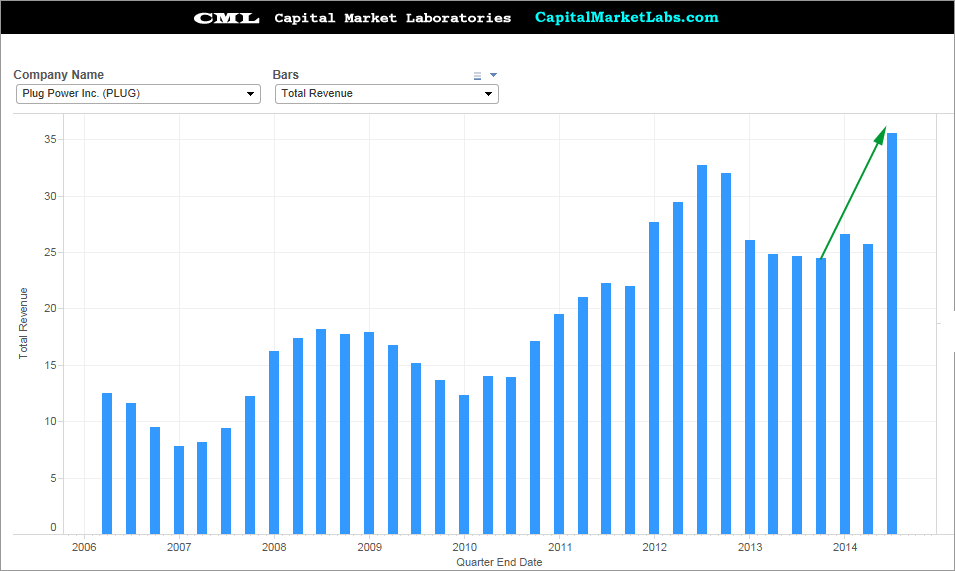
Revenue (TTM)
We'll start simple at look at revenue (trailing twelve months). We can see that revenue had dipped then stagnated for a while, but last quarter the company showed a huge pop in revenue from $5.3M the two quarters ago, to over $17M in the last earnings report.
The "no revenue growth" story of PLUG is now dead -- revenue is growing, simple as that.
Revenue (TTM) to Net Income (TTM)
I've added net income (earnings) in the red line to the chart. Earnings have been losses for a long time, dipped recently to even worse levels and last quarter showed a positive number... yep, PLUG earned $3M last quarter (Adjusted for one-time losses, Plug lost 4 cents a share, which was in line with expectations according to MarketWatch). That positive number has turned the rolling trailing-twelve-month figure upward (red line tipped up). The firm's CEO has projected profitability moving forward after some high profile deals with Wal-Mart, Honda (the newest one), BMW and Volkswagen.

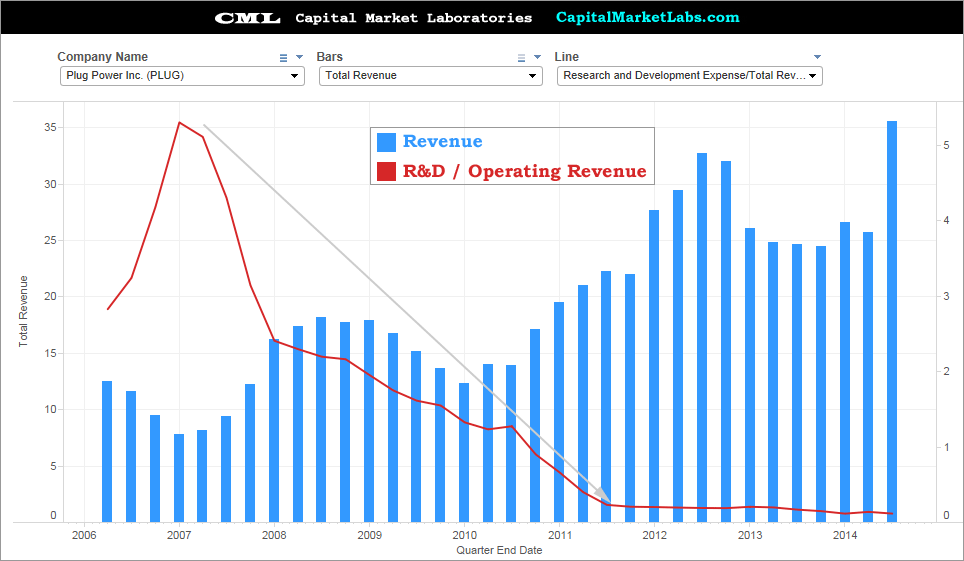
Revenue (TTM) vs. Research & Development per Dollar of Revenue
This chart looks insane. The blue bars are still revenue, the red line is now R&D per dollar of revenue. It's a total collapse from spending $5 of every one dollar in revenue to now spending $0.12 (12 cents).
----> Do This Yourself
But, before we scream bloody murder... what for the next chart.
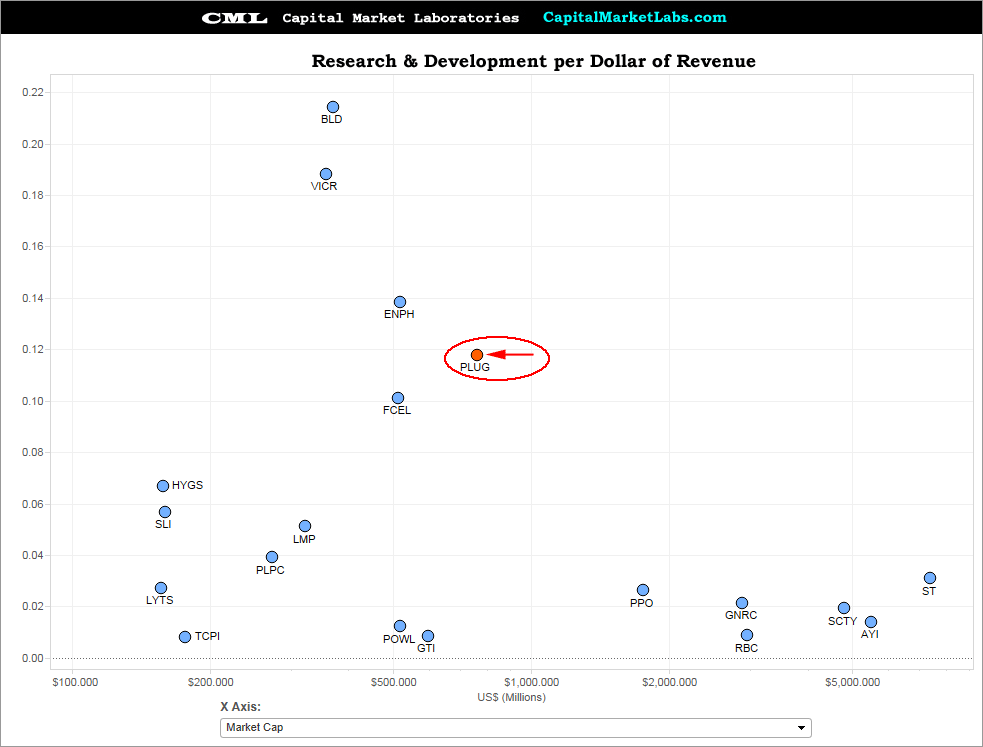
Research & Development per Dollar of Revenue vs. Peers
When we look at PLUG's spending on R&D relative to peers, it's actually pretty normal. The firm is near the top, but not an outlier in any sense. the craziness of the chart above was the rate of R&D back in 2009, not the rate right now. AS I said, no bloody murder here...
----> Do This Yourself
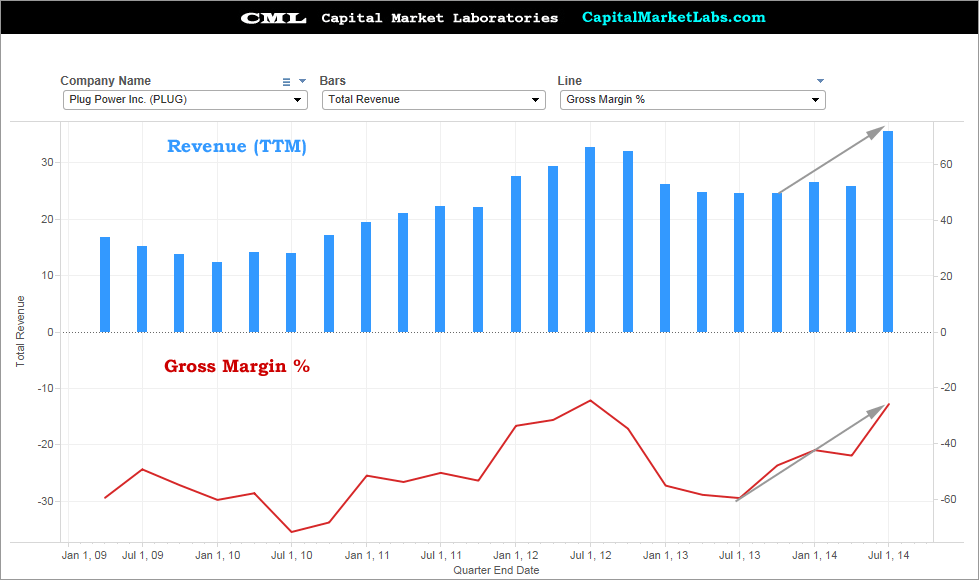
Revenue (TTM) vs Gross Margin %
We have revenue as the blue bars again and the red line this time is gross margin %. While there was no bloody murder to scream in the last two-charts, this one and the next are kind of... well... you'll see.
Gross Margin % is negative for PLUG (which is kind of bonkers), though the trend is moving upward as revenue is increasing. That's a good trend, but a terrible current point in time.
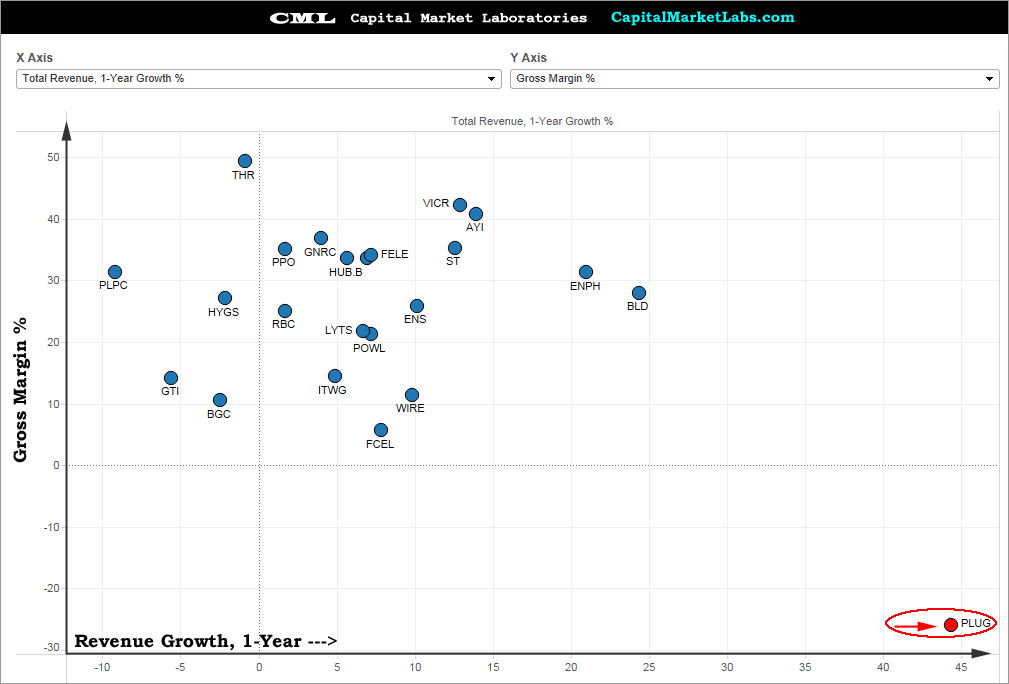
Revenue Growth, 1-Year vs. Gross Margin %
With one-year revenue growth on the x-axis and gross margin 5 on the y-axis, we can see PLUG is growing revenue faster than any peer by a lot, and also has worse gross margin % to any peer by a lot. In fact, every peer have positive gross margin % other than PLUG.
----> Do This Yourself
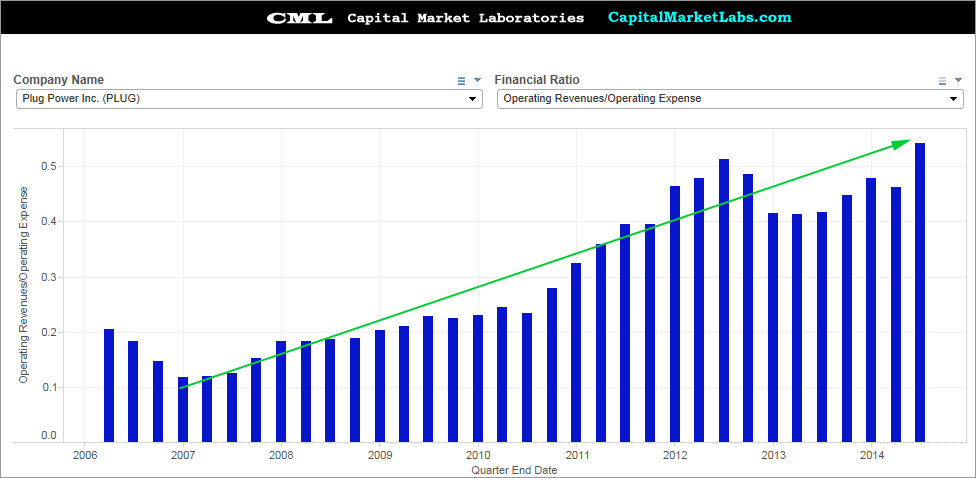
Operating Revenue / Operating Expense
Ultimately there's a lot in between revenue and net income and this is the measure that connects them. For every dollar in operating expense, PLUG generates only $0.55 in revenue. That's not good. A firm must, at a minimum, earn $1 in revenue for every dollar in expense (obviously). PLUG is nowhere near that mark over the trailing-twelve-months but... and this is a big one... The trend is exploding up in the right direction.
In any case, this number better get better fast (as it has been), or PLUG is in some trouble.
Make these charts yourself
This is trade analysis, not a recommendation.
Follow @OphirGottlieb
Tweet
Legal Stuff:
Options involve risk. Prior to buying or selling an option, an investor must receive a copy of Characteristics and Risks of Standardized Options. Investors need a broker to trade options, and must meet suitability requirements.
The information contained on this site is provided for general informational purposes, as a convenience to the readers. The materials are not a substitute for obtaining professional advice from a qualified person, firm or corporation. Consult the appropriate professional advisor for more complete and current information. I am not engaged in rendering any legal or professional services by placing these general informational materials on this website.
I specifically disclaim any liability, whether based in contract, tort, strict liability or otherwise, for any direct, indirect, incidental, consequential, or special damages arising out of or in any way connected with access to or use of the site, even if I have been advised of the possibility of such damages, including liability in connection with mistakes or omissions in, or delays in transmission of, information to or from the user, interruptions in telecommunications connections to the site or viruses.
I make no representations or warranties about the accuracy or completeness of the information contained on this website. Any links provided to other server sites are offered as a matter of convenience and in no way are meant to imply that I endorse, sponsor, promote or am affiliated with the owners of or participants in those sites, or endorse any information contained on those sites, unless expressly stated.


No comments:
Post a Comment