Friday, May 28, 2010

EEM (iShares MSCI Emerging Markets ETF) - Huge Bet for Emerging Markets New Lows Within One Month

***** UPDATE *****

60,000 of these same butterflies traded 5-24-2010 (four days ago).

*****************

EEM (iShares MSCI Emerging Markets) is trading 38.10, down 1.7% with IV30™ up 8.8%. The LIVEVOL™ Pro Summary is below.


The ETF has traded over 500,000 options on total daily average option volume of 271,400. The puts have traded on an 8:1 put:call ratio. The largest trade, accounting for 300,000 contracts, was a Jun 25/30/35 put butterfly. The Stats Tab and Day's biggest trades snapshots are included (click either image to enlarge).


The 25/30/35 butterfly PnL is included (click to enlarge).
Price: $0.48 + $0.03 - 2*$0.11 = $0.29
Outlay (Max Loss): 100 * 75,000 * $0.29 = $2,175,000
Max Gain: 75,000*100*($5 - $0.29) = $35,325,000


The trade makes $35 million at expo if EEM pins at or near $30. The Skew Tab snap (click to enlarge) illustrates the vols in the trade.


It's actually a very pretty skew. Essentially a perfect shape. I don't see this as a skew bet, it's a delta bet.

Finally, the Charts Tab (6 months) is below (click to enlarge). The top portion is the stock price, the bottom is the vol (IV30™ - red vs HV20™ - blue). The yellow shaded area at the very bottom is the IV30™ vs. the HV20™ vol difference.


The 52 wk. range is [30.12 46.66]. The one phenomenon that jumps out at me is the color of the volume bars at the bottom (circled). You can see they are mostly red - this indicates a pre-dominance for open order put purchases by customers on ISE. Or, in English, bearish customer order flow.

Make no mistakes - this is a bet that reaches max gain if the Emerging Markets Equity Index hits a new low in the next four weeks.

This is trade analysis, not a recommendation.

Legal Stuff:
http://www.livevolpro.com/help/disclaimer_legal.html

FXY (Japanese Yen) - Bet on Yen Upside Points to Bet on a Market Tumble

FXY (Yen) is trading 109.31. The LIVEVOL™ Pro Summary is below.


This blog is connected to the "The European Crisis Explained and Currency Option Trading" blog. Click Here to read that one. It's inextricably linked to the European crisis.

The Yen Trust has traded over 17,000 options in the first two hours on total daily average option volume of just 1,894. All but 128 contracts have been calls. The largest trade has been a 110/125 call spread purchase in Jan 2011. The Stats Tab and Day's biggest trades snapshots are included (click either image to enlarge).


The Options Tab (click to enlarge) illustrates that the calls are mostly opening (compare OI to trade size). You can also see that there is no OI even close to that large anywhere else near the money.

This is a bet that the Japanese Yen goes up. The total outlay is 100 * 8709 * ($4.40 - $1.00) = $2,961,060. Max gain is at 125 for $10,399,440.


The Skew Tab snap (click to enlarge) is included. I have just shown Jan 2011.


As the prior blog discussed, the Yen shows upside risk; i.e. the upside is more expensive than the downside. I have highlighted the 110 and 125 calls. This is a bet that gets long while selling the expensive vol (the upside).

This bet is not in a vacuum. It implies not just a bet on the strength of the Yen, but possibly/probably on a downward move in the GBP, Euro and an upward move in the USD relative to those two. The way the market has behaved recently, that would imply a downward move in our equity indices.

This is trade analysis, not a recommendation.

Legal Stuff:
http://www.livevolpro.com/help/disclaimer_legal.html

Cubist Pharma (CBST) - Call Spread on Elevated Vol

CBST is trading 21.65, up 3.3%. The LIVEVOL™ Pro Summary is below.


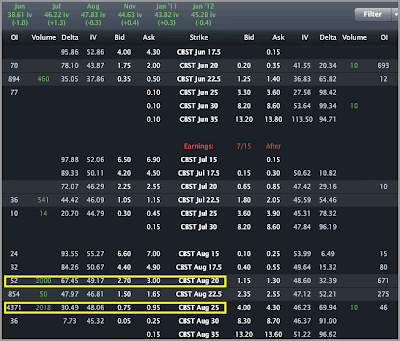
The company has traded over 5,100 options in the first hour on total daily average option volume of just 351. All but 50 contracts have been calls. The largest trade has been an Aug 20/25 call spread purchase 2000x. The Stats Tab and Day's biggest trades snapshots are included (click either image to enlarge).


The Options Tab (click to enlarge) illustrates that the 20 calls are opening compare OI to trade size). The 25 calls are unclear at first glance. Upon further investigation I think the 25 calls are long interest, so these sales are closing OI.


You can also see that Jun vol is well below the rest of the months (at the top of the snap). The call spread went for $2.99 - $0.77 = $2.22. The max gain is $5 - $2.22 = $2.78. The max gain:max loss is ~1.25:1. CBST 52 wk. low is $16.27, 52 wk. high is $24.38.

The Skew Tab snap (click to enlarge) is included as well. We can see clearly how low Jun vol (red) is relative to the rest, in particular, Aug (green).


We can also see that the Aug 20 purchase is about the same vol as the Aug 25 sale which is a nice little trick getting equal vol on the upside skew. Note how the Aug 30 line dips.

This is a small bio-tech with lawsuit pending. The skew/vol seem to indicate something happening after this month, though there is at least one scheduled event on Jun 9 (a court case hearing).

This is trade analysis, not a recommendation.

Legal Stuff:
http://www.livevolpro.com/help/disclaimer_legal.html

Thursday, May 27, 2010

E-House (EJ) - Call Buyer Pushes Summer Vol Past Nov

EZ (a real estate services company in China) is trading 14.42, 3.1% today with IV30™ up 3.9%. The LIVEVOL™ Pro Summary is below.


The company has traded over 7,000 options today on total daily average option volume of just 1,578. All but 202 contracts have been calls. The action has been in the Jul 17.5 calls (purchases). The Stats Tab and Day's biggest trades snapshots are included (click either image to enlarge).


The Options Tab (click to enlarge) illustrates that the calls are opening (compare OI to trade size). You can also see that Jul vol is up 5.4 points while Jun is up just 0.1 and Aug is up 2.0. This pushes the Jul vol to 74.05 which is greater than Aug (71.75) even though earnings are in the Aug cycle (a vol event).


The Skew Tab snap (click to enlarge) illustrates how the 17.5 line has jumped relative to the other lines. Also note how low Nov is relative to the summer.


Finally, the Charts Tab (6 months) is below (click to enlarge). The top portion is the stock price, the bottom is the vol (IV60™ is orange, IV30™ is red and HV20™ is blue). The yellow shaded area at the very bottom is the IV30™ vs. the HV20™ vol difference.


The Jul 17.5 calls went for $0.45 so the trade (if naked) breaks even at $17.95. I've drawn a light blue horizontal line at the 17.5 strike (ish). We can see that EJ has been well above recently. The 52 wk. high is $24.39.

This is trade analysis, not a recommendation.

Legal Stuff:
http://www.livevolpro.com/help/disclaimer_legal.html

Principal Financial (PFG) - Summer Put Buyer on Convergent/Divergent Vol

PFG is trading 27.16, up 4.2% with IV30™ down 8.0%. The LIVEVOL™ Pro Summary is below.


The company has traded nearly 9,000 options in the first hour on total daily average option volume of just 1,718. All but 747 contracts have been puts. The largest trade has been the Jul 26 puts, where volume is over 7,500. The Stats Tab and Day's biggest trades snapshots are included (click either image to enlarge).


The Options Tab (click to enlarge) illustrates that the puts are mostly opening (compare OI to trade size). Another thing I've highlighted is the Jan '12 vol compared to the current month. This is the same phenomenon I wrote about yesterday with AAPL, AMZN, BAC and WMT - the 2012 option vol is persistently high. In fact, you can see that while IV30™ (30 day implied) is lower by 8% today, the Jan 2012 vol is up 4.1 points (or up about 8%). So a total divergence. The article on this phenomenon and what it might imply is available by Clicking Here.


The Skew Tab snap (click to enlarge) illustrates the Jul 26 put vol. It's interesting to see that July downside vol (summer) is the same level as Oct. usually we see lower summer vol as the market tends to stay range bound, news is thin and traders are in the Hamptons. For this company however, you can see that the Jul and Oct vols are identical on these puts.


Finally, the Charts Tab (6 months) is below (click to enlarge).

The top portion is the stock price, the bottom is the vol (IV60™ is orange, IV30™ is red, HV20™ is blue). The yellow shaded area at the very bottom is the IV30™ vs. the HV20™ vol difference.


You can see that the implied (both 30 and 60 day) is below the realized vol for PFG.

This is trade analysis, not a recommendation.

Legal Stuff:
http://www.livevolpro.com/help/disclaimer_legal.html

Wednesday, May 26, 2010

The Global Economy and the Market Price of Vol Moving Forward

This keeps me up at night...

In the recent weeks of market volatility, the hyper focus has been on global economies. In the short-term what's going to happen with Europe and the Euro Zone? Is the US immune? Is the "jobless" recovery going to sputter?

The short term focus has revealed a longer term trend in the options market. I'll discuss four companies, a tech bell weather (AAPL), the largest "bricks and mortar" retailer (WMT), the largest online retailer (AMZN) and the largest bank (BAC). The LIVEVOL™ Pro Summaries are below.


The monthly vol term structure for each is included below (click any image to enlarge).


I've highlighted the front month and Jan 2012 vols. Notice for each that the current vol is lower than the back. This is pretty unusual and is symptomatic of the majority of the market.

The Skew Tab snap for WMT with just Jun and Jan '12 is included (click to enlarge).


I've circled the ATM vols. You can see how much higher Jan '12 is relative to Jun.

A week ago we saw a 45 VIX with IV30™ of 167 (i.e the vol of vol). The VIX has come down 33% and the iv in the VIX has dropped 60 points as well.


While the near term end of the world scenario has eased up (for today at least), the back months are not as much. Below you can see the vol changes for this month and Jan 2012 of our four test cases today. These are all negative moves (vol is down today). I have omitted the "-" sign for ease of reading.


We're seeing 12%-16% vol drops today in the front months, but only 3%-5% drops in the back. The option market is implying a volatile future... Not for the next month or two. Not into Fall... This is out to January 2012.


This is trade analysis, not a recommendation.

Legal Stuff:
http://www.livevolpro.com/help/disclaimer_legal.html

Rambus (RMBS) - Huge Trade on Court Decision Right Now

*********** UPDATE ***********

Since this was posted, the IV30™ has jumped 7 points.


*****************************

RMBS is trading 25.10. The LIVEVOL™ Pro Summary is below.


This is a continuation of the first blog: "Rambus (RMBS) - Trading a Lawsuit". The decision is due out today. You can read the first blog by Clicking Here.

-------------------
Since no one will actually do that, let me catch you up.

Jan 18, 2010
Click Here for Reference.
Samsung Electronics Co. agreed to pay as much as $900 million over five years to Rambus Inc. as part of a deal to settle some high-profile litigation focusing on memory chips.

You can see the pop in the stock after (click to enlarge):


Barrons came out with a great story relaying what's at stake and possible outcomes.
Click Here for Reference.
Rambus (NASDAQ: RMBS) has recently settled a patent case with Samsung. The company is also currently involved in separate lawsuits worth $12 billion against Micron Technology (NASDAQ: MU) and Hynix Semiconductor. Investors are bullish about the outcome of these
lawsuits.

According to a report released by Barron’s, the stock is expected to grow by 100% in the case of a positive outcome. However, the chipmaker has a bleak scenario if its lawsuits fail. Harold Hughes, CEO of Rambus, said, “We do not intend to give Hynix or Micron a deal comparable to the one we gave to Samsung."

-------------------

Yup - the stock could go to "zero" or double if there are "extreme" judgements.

Ok, so here we are, decision day. A trader (and reader), Eddy Altamirano, drew my attention to a huge trade early on (45 min. into the trading day).

The company has traded over 19,500 options in the first hour on total daily average option volume of just 10,813. The attention grabbing trade was 9,300 Jun 21 puts sold. The Stats Tab and Day's biggest trades snapshots are included (click either image to enlarge).


The Options Tab (click to enlarge) illustrates that the puts are mostly opening (compare OI to trade size).


The Skew Tab snap (click to enlarge) illustrates exactly the vol of those puts relative to the rest of the chain.


Note the pronounced skew in the front month (red) relative to the other months. You can also see how elevated the vol is in Jun. There was a large stock print four minutes after the option trade so it's possible someone turned those puts into short straddles. It looks like 215,000 traded which would be on the delta (i.e. not 1:1 straddles).

In the first blog I noted that the vol for the ATM straddle seemed low (it was 64 vol). The ATM vol is now near 115. I also noted that the front month (at the time May) was probably a sale. Things have changed now... The decision is apparently due out at any moment, the front month vol has nearly doubled and now the back months are less expensive (vol).

I get the feeling that no one really believes this stock can double from here. I don't know why that is, and I'm not taking a position either way. I'm just noticing the front 30 calls are only worth ~$0.90 and the 19 puts are worth ~1.00... Both seem cheap if a definitive decision comes out. But of course, that's the catch-22 in this case. Definitive decisions keep getting delayed.

Buying the wings now is less about betting on the importance of the outcome, and more about the fact that there will be an actual outcome.

This is trade analysis, not a recommendation.

Legal Stuff:
http://www.livevolpro.com/help/disclaimer_legal.html

Tuesday, May 25, 2010

Short Dow 30 (DOG) - Bets Build on a Market Down Turn

DOG (Short Dow 30) is trading 53.84 up 1.8%. The LIVEVOL™ Pro Summary is below.


The ETF has traded over 6,300 options on total daily average option volume of just 625. All but 244 contracts have been calls for a 25:1 call:put ratio. The largest trades have been the front month 52 and 53 calls. The Stats Tab and Day's biggest trades snapshots are included (click either image to enlarge).


The Options Tab (click to enlarge) illustrates that open interest in both the 52 and 53 calls is about as large as the trade volume. By digging into the Level II details, I found that on 5-19-2010 (i.e. last Wednesday) the OI in the calls started to jump. Not surprising, it's long open interest. The OI in these two lines as of tomorrow will be very large relative to any other lines.


The Skew Tab snap (click to enlarge) illustrates clearly the vol of those two lines relative to the rest of the chain.


Notice how the skew chart looks like an inverted (mirror) image of a normal skew. This makes sense since calls in this are in fact puts in the Dow, so we see higher vol on the upside than the downside. Also notice that the calls purchased are ATM, this makes them cheaper vol (again see the skew chart). i.e. Replace some vega risk with delta risk.

Finally, the Charts Tab (6 months) is below (click to enlarge), just the stock chart this time.


You can see the rip upside recently. Bets are building on a lower market, though this bets stays away from the expensive "wings" vol.

This is trade analysis, not a recommendation.

Legal Stuff:
http://www.livevolpro.com/help/disclaimer_legal.html

CenturyTel (CTL) - Huge Put Purchase on June Upside Skew Collapse (Why Skew Matters)

CTL is trading 33.24 with IV30™ up 14.8%. The LIVEVOL™ Pro Summary is below.


The company has traded over 10,000 puts in the first hour on total daily average put volume of just 501. The call:put ratio is 1:165 with essentially all of the volume in the Jul 30 puts. The Stats Tab and Day's biggest trades snapshots are included (click either image to enlarge).


The Options Tab (click to enlarge) illustrates that the puts are mostly opening (compare OI to trade size). Note also the large OI in the Jun 35 calls (though only a one lot has traded today on that line).


The Jun 35 calls OI jumped from 181 to 9,271 on Apr 23 (so the trade was Apr 22). The largest trades for that day are included (click to enlarge).


You can see there were huge sales of both the Jun 35 calls @ ~$0.85 and the May 35 calls @ $0.75. The May calls have expired worthless, so they were a nice winner. Note the purchase price of the puts today (Jun 30 puts) for $0.85. If this is the same trader (feels like it is) - then s/he paid for his puts with the premium collected in the calls a month ago.

The Skew Tab snap (click to enlarge) illustrates a couple of things.


1) You can see the vol in the Jul 30 puts relative to the rest of the chain.
2) Even more cool, check out the vol in the Jun 35 calls.

It looks to me like that absolute collapse in Jun 35 vol (there is short interest there) has enabled the trader to go ahead and use that premium for the Jul puts.

Finally, the Charts Tab (6 months) is below (click to enlarge). The top portion is the stock price, the bottom is the vol (IV30™ - red vs HV20™ - blue). The yellow shaded area at the very bottom is the IV30™ vs. the HV20™ vol difference.


Note the IV30™ relative to the actual move (HV20™). The options market is looking for a larger move than the stock has had recently. But oddly enough, almost no probability that an upside move occurs in Jun. Kinda cool.

This is trade analysis, not a recommendation.

Legal Stuff:
http://www.livevolpro.com/help/disclaimer_legal.html