| Tweet | Follow @OphirGottlieb |  |  |

This visualization is provided by:
Make These Visualizations Yourself: Free Trial
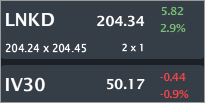
LNKD is trading $204.34, up 2.9% with IV30™ down 0.9%. The Symbol Summary is included below.
Provided by Livevol
------------------------------------
UPDATE 10-30-2014
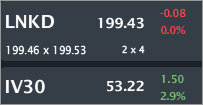
LNKD is now trading $199.43, down small with IV30™ up 2.9%. The Symbol Summary is included below.
Provided by Livevol
There is also an update to the "expected" pricing off of earnings by the option market.
------------------------------------
Conclusion
LNKD has a strong upward trend in revenue, has maintained very high gross margin % even as revenues grow, but faces a downward trend in earnings (net income) and its valuation (price to sales) has dropped from its highs indicating lessened expectations for the immediate-term (unlike NFLX before earnings). But aside from revenue and growth forecasts, there is one measure which has my eye -- it's kindof boring and certainly not sexy (like user growth!)... but it may be the whole kit-and-caboodle.
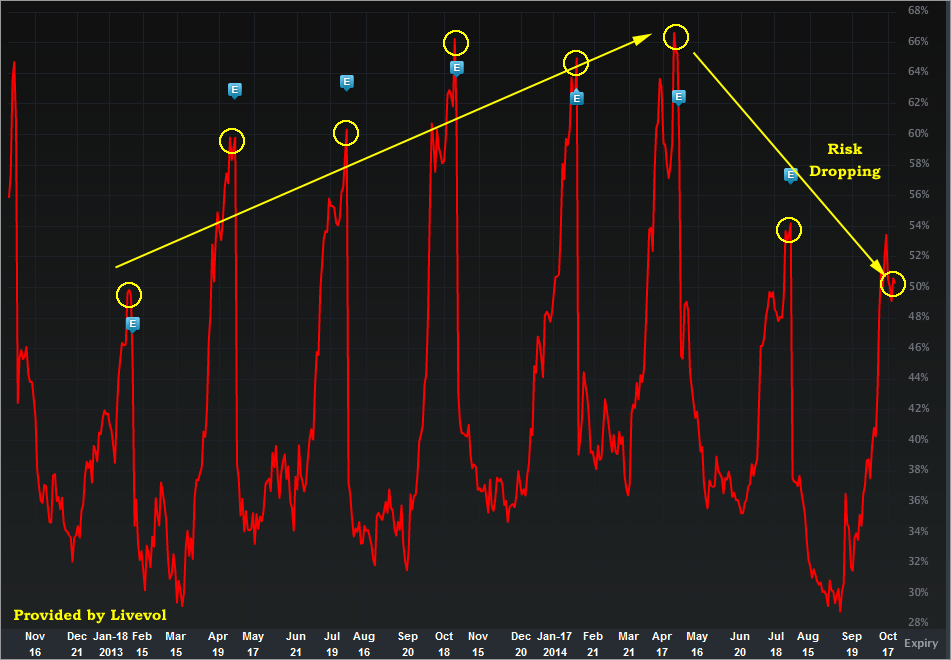
In the meantime, risk in the stock as reflected by the option market is dipping and is near an all-time low for an earnings cycle.
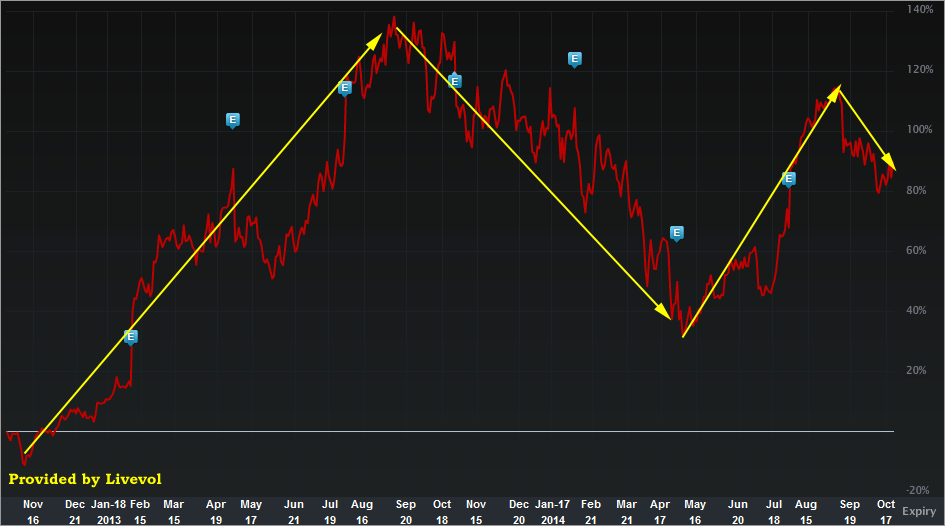
The two-year stock return chart is included below.
Provided by Livevol
LNKD moves like every other MOMO, that is, in abrupt cycles. The only difference, or oddity, is that LNKD tends to move in cycles for a longer period of time than some of the other MOMOs. So we see protracted time frames of stock price increases and decreases.
Now let's turn to the financial measures and what exactly to look for from earnings.
Total Revenue (TTM)
So this is easy-breezy; LNKD revenue is booming to now just under $2B in the trailing-twelve-months.
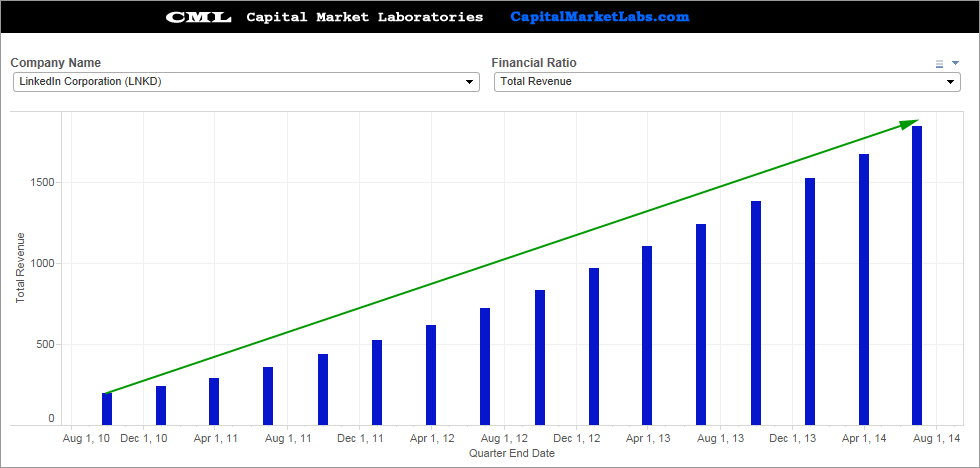
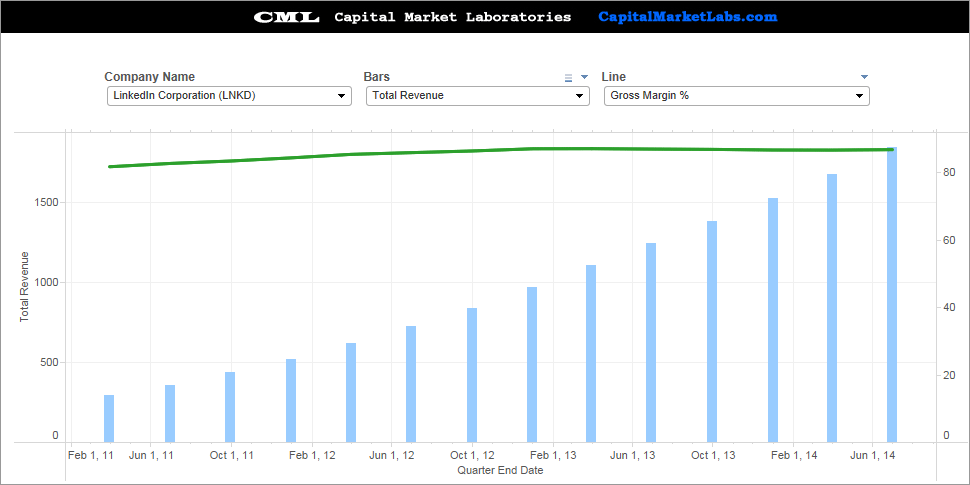
Total Revenue (TTM) vs. Gross Margin %
I sound like a robot by now, but it's still the case, the Internet Software & Services Industry is particularly interesting as an investment due to its remarkable gross margin %. The key (a key) is to find firms that can maintain a steady state in gross margin % as they grow revenue.
The blue bars show the revenue growth and the green line shows the steady state of gross margin % of well over 80%. This is a very good chart for LNKD.
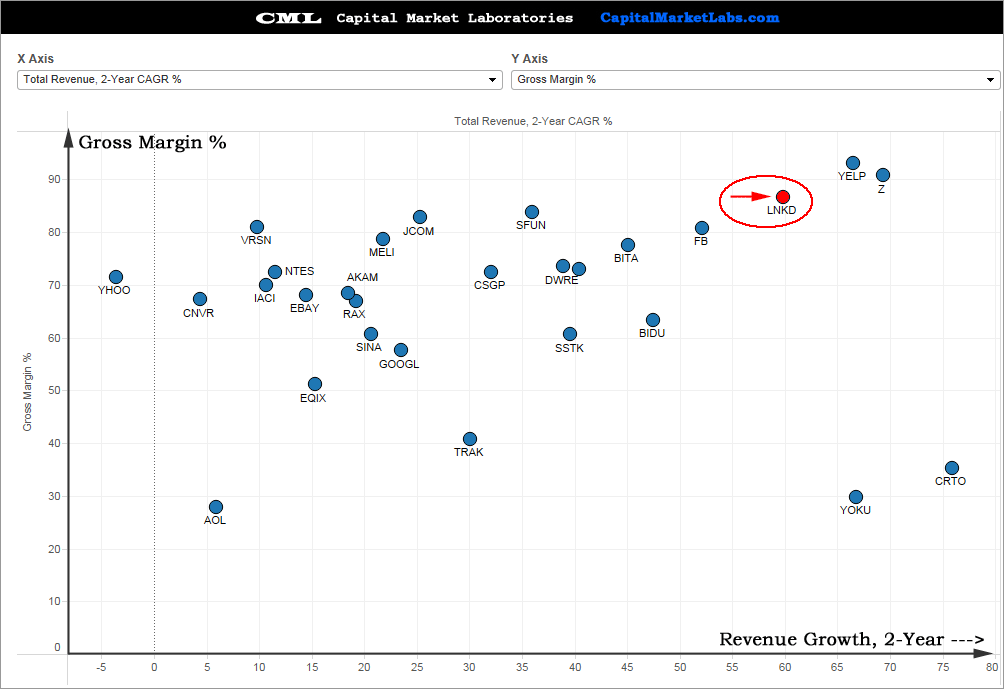
Gross Margin % vs. Revenue Growth (2-year) vs. Peers
With gross margin % on the y-axis and revenue Growth, 2-Year on the x-axis we can see that LNKD is near the head of the class. Revenue are growing and it's steady state of gross margin % is in fact quite high, even against peers in the same industry.
Thus far we've seen all "good" stuff for LNKD.
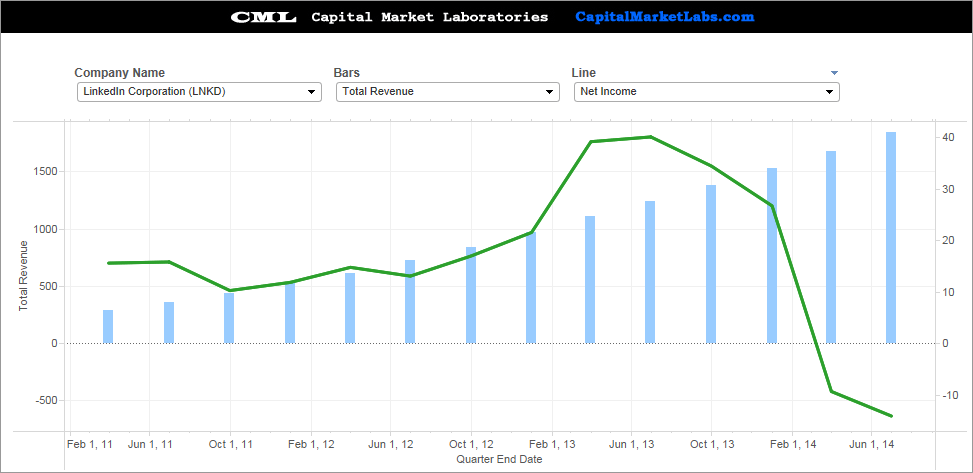
Revenue (TTM) vs. Net Income (TTM)
Here's where we move away from "good" to... ya know... not so good... The blue bars are revenue and the green line is net income (aka earnings). We can see the abrupt change in earnings, but I do note one huge mitigating factor: earnings went from ~$38M to now a loss of ~$14M. those are tiny numbers with respect to revenue in the $2B range.
Don't get caught without all the information -- note the scale.
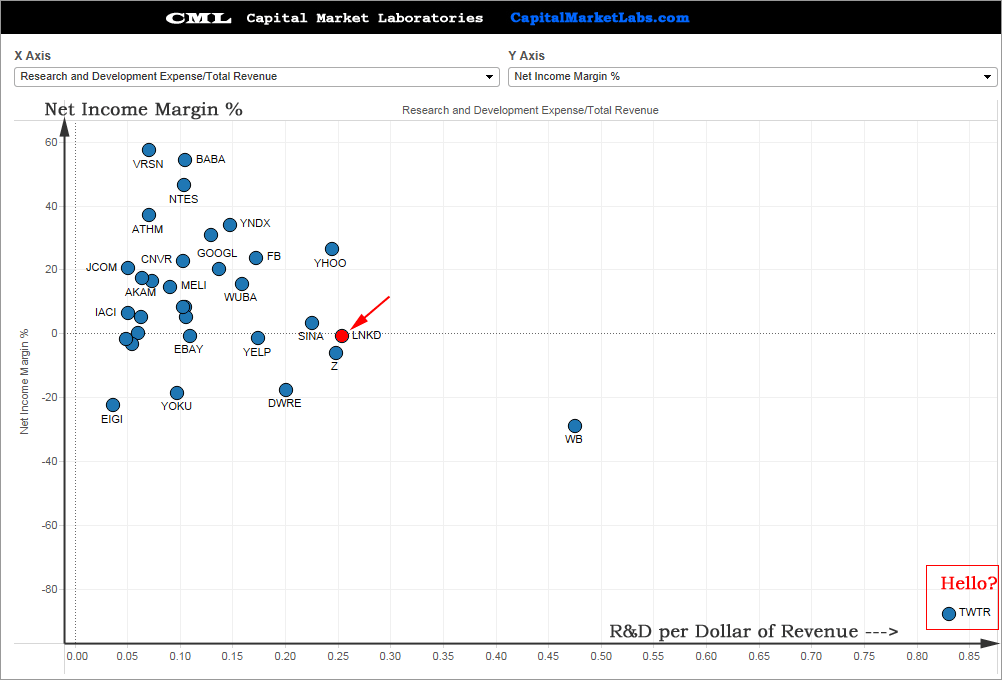
Net Income Margin % vs. R&D vs. Peers
With Research & Development per dollar of Revenue on the x-axis, and Net Income Margin % on the y-axis, we can see LNKD is pretty high with respect to R&D (far to the right), but quite low with respect to earnings margin % (low on the y-axis).
I do note the crazy wild outlier, which is TWTR. For more on TWTR, you can read this post:
TWTR - Earnings Preview: The Trends that Define Absolutely Everything.
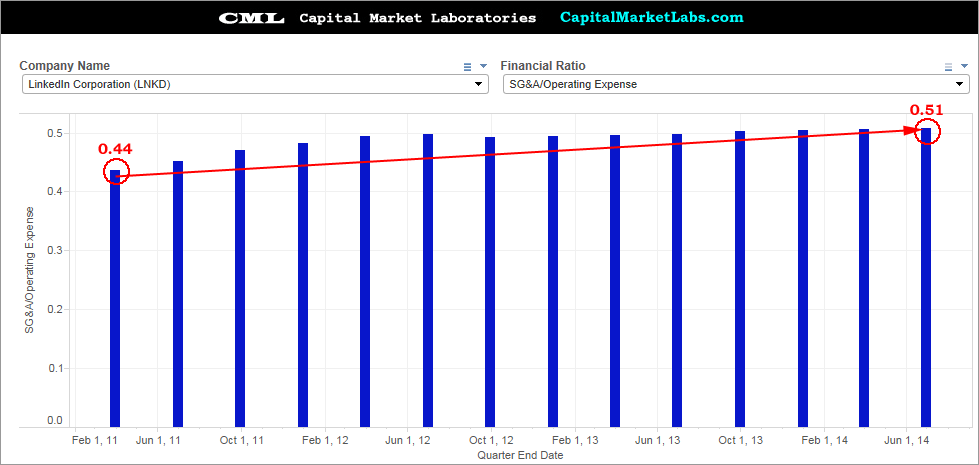
Selling, General & Administrative (SG&A) per dollar of Operating Expense
This is sneaky measure that I do believe is having a substantive impact on LNKD. Since gross margin % is high and steady, but net income margin % is near zero (or negative), there is a step in between that gets us there. That step is SG&A expense.
LNKD has gone from spending $0.44 of every $1 in operating expense on SG&A to now $0.51 (an all-time high in the trailing-twelve-months). After the revenue number (and growth forecasts), this is the number to watch for LNKD on earnings release. They must get this number under control to turn a sizable profit in the future.
It ain't sexy, but in my opinion, it's the juice (after revenue and growth forecasts).
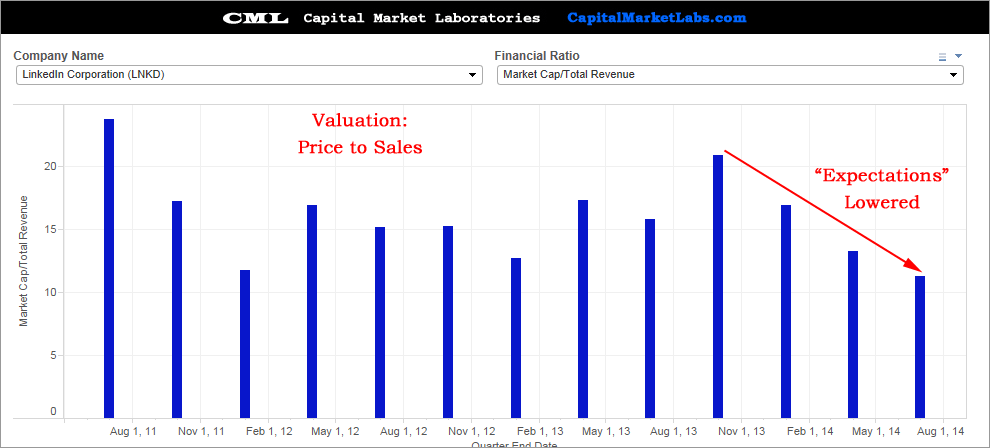
Valuation: Price / Sales
We can't do a P/E time series because LNKD has negative "E" right now. But, we can look at price to sales. I note that LNKD spiked to a P/S of over 20 and then totally collapsed (both in P/S and simply stock price).
With a lower P/S right now, this is a reflection of slightly lowered expectations for LNKD (slower acceleration of revenue and earnings), very much unlike NFLX into its earnings. The lower P/S is actually a sign that an earnings report of "perfection" may not be needed. "very good" should do the trick.
Having said all of that, this is a firm with a $25B market cap and no earnings... so, expectations are still very high...just not "as high."
Now let's turn to risk pricing. The IV30™ chart in isolation, below.
Provided by Livevol
The implied volatility is the forward looking risk in the equity price as reflected by the option market (IV30™ looks forward exactly 30 calendar days).
In English, the red curve is the risk in future stock price movement. the blue "e" icons represent earnings dates and we can see rather clearly the trend of increasing risk, and now the trend of decreasing risk. Earnings aren't due out for a week, so that red curve should rise a little, but this is a non-trivial result. A big move in LNKD stock price off of earnings, would be a "surprise" if you believe the option market... Do you?...
Finally, the Options Tab is included below.

Provided by Livevol
Using the at-the-money (ATM) straddle we can see that the option market reflects a price range of [$186.50, $223.50] by the end of trading on October 31st.
That range through the end of trading on Nov 21st is [$182, $228].
UPDATE 10-30-2014
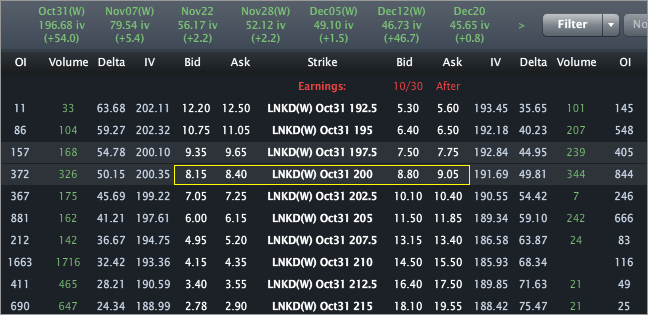
The price range relfected by the option market by the end of trading on Oct 31st is now [$183, $217].
- If you believe the stock will be outside that range on expiry or any date before then, then you think the volatility is too low.
- If you believe that range is too wide, and that the stock will definitively be in that range on expiration, then you think volatility is too high.
- If you're not sure, and can make an argument for either case, then you think volatility is priced just about right.
This is trade analysis, not a recommendation.
Follow @OphirGottlieb
Tweet
Legal Stuff:
Options involve risk. Prior to buying or selling an option, an investor must receive a copy of Characteristics and Risks of Standardized Options. Investors need a broker to trade options, and must meet suitability requirements.
The information contained on this site is provided for general informational purposes, as a convenience to the readers. The materials are not a substitute for obtaining professional advice from a qualified person, firm or corporation. Consult the appropriate professional advisor for more complete and current information. I am not engaged in rendering any legal or professional services by placing these general informational materials on this website.
I specifically disclaim any liability, whether based in contract, tort, strict liability or otherwise, for any direct, indirect, incidental, consequential, or special damages arising out of or in any way connected with access to or use of the site, even if I have been advised of the possibility of such damages, including liability in connection with mistakes or omissions in, or delays in transmission of, information to or from the user, interruptions in telecommunications connections to the site or viruses.
I make no representations or warranties about the accuracy or completeness of the information contained on this website. Any links provided to other server sites are offered as a matter of convenience and in no way are meant to imply that I endorse, sponsor, promote or am affiliated with the owners of or participants in those sites, or endorse any information contained on those sites, unless expressly stated.


No comments:
Post a Comment