| Tweet | Follow @OphirGottlieb |  |  |

This visualization is provided by:
Make These Visualizations Yourself: Free Trial
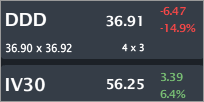
DDD is trading $36.91, down 14.9% with IV30™ up 6.4%. The Symbol Summary is included below.
Provided by Livevol
Conclusion
DDD is down today on this news: 3D Systems cuts revenue forecast due to production issues
The issue, according to the CEO, is simply that the firm could not meet the robust and booming demand, not that demand or its products are not selling.
I will show you six charts, three of which may make you believe, beyond a shadow of a doubt that this firm is a great stock to own.
Then I will show you three other charts that Wall St. will not show you, and these charts will put doubt into your mind... That doubt is in fact knowledge. While 3-D printing in general is a crazy innovative, potentially world changing technology, that fact, and some simple click bait articles will not help you understand the bet you are making if you own this stock. It's an unknown, that's OK. Just understand the unknowns.
It's OK to lose money on an investment -- it happens all the time. It's not OK to lose money due to lack of knowledge. Don't let that happen to you.
Knowledge is Power. Be Powerful. Make These Visualizations Yourself: Free Trial
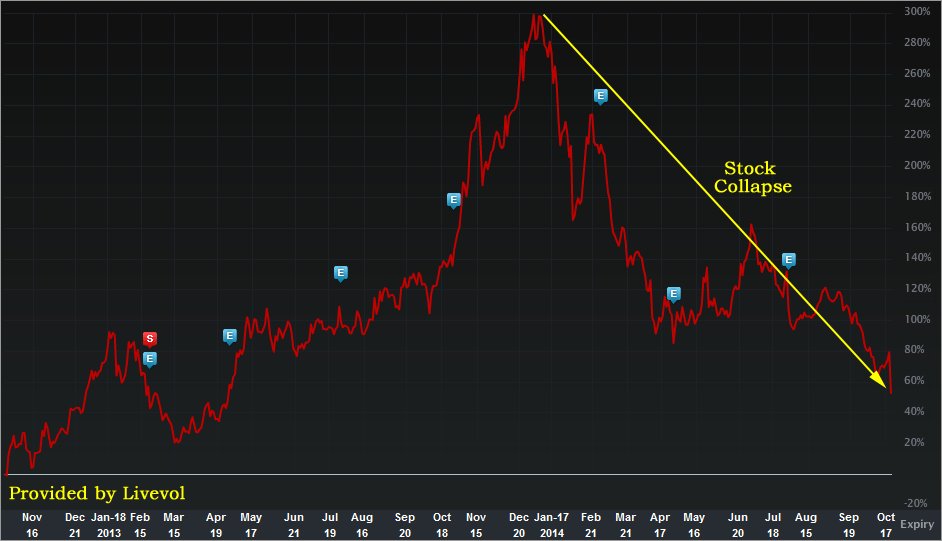
The two-year stock return chart is included below.
Provided by Livevol
We can see rather clearly that the drop in stock price today is in no way a "new trend." Wall St. has soured on this stock (for now). It once traded over $97. It now trades under $37.
Let's turn to the power of visual data and really understand what's going on.
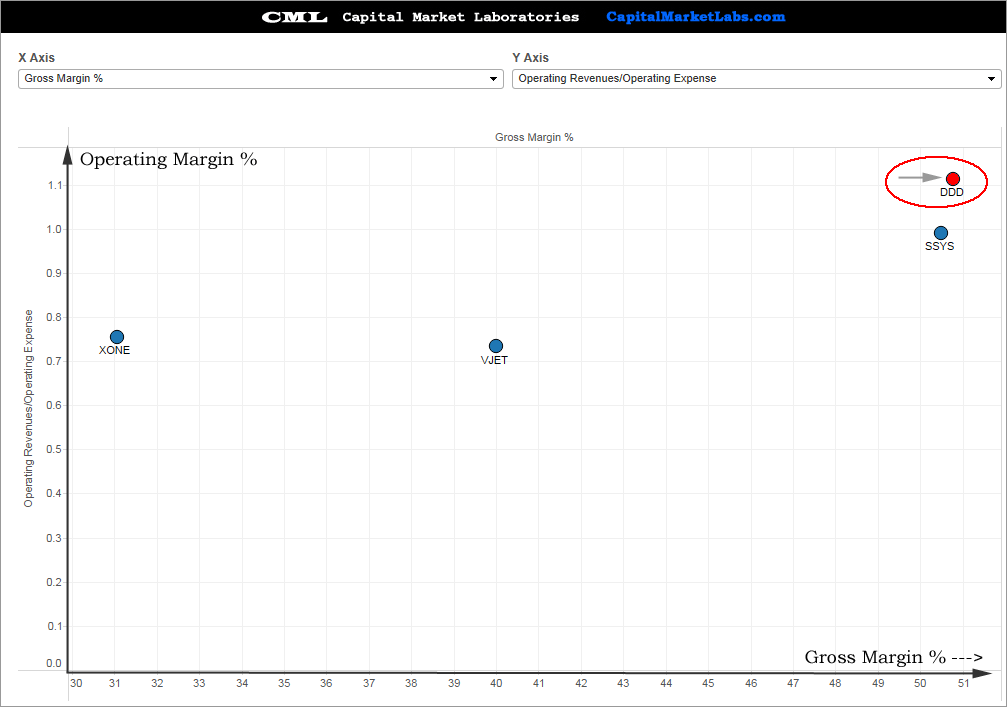
Operating Margin % vs. Gross Margin % vs. Peers
Defining a peer group is next to impossible, so we'll have to work with these four firms with market caps above $150MM and in the same industry. In any case, we can see rather clearly, DDD has the largest operating margin % (y-axis) and the largest gross margin % (x-axis) of the peer group.
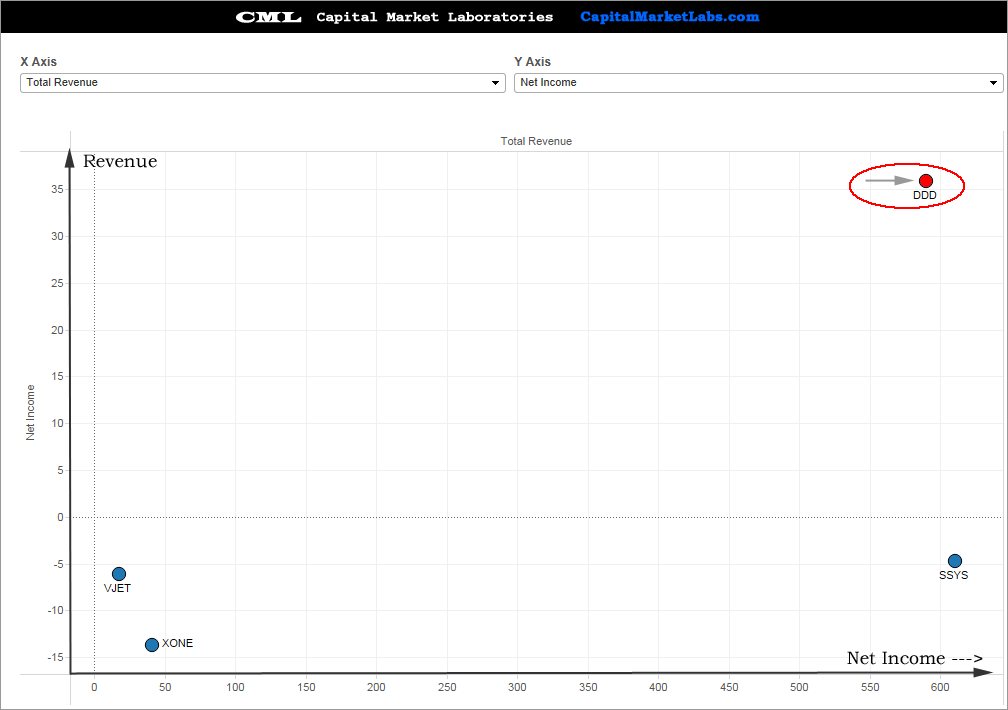
Total Revenue (TTM) vs. Net Income (TTM) vs. Peers
Bringing it up a level to the top and bottom lines, we can see DDD has the largest revenue (y-axis) and largest net income (x-axis) of the group (in the trailing-twelve-months).
Make These Visualizations Yourself: Free Trial
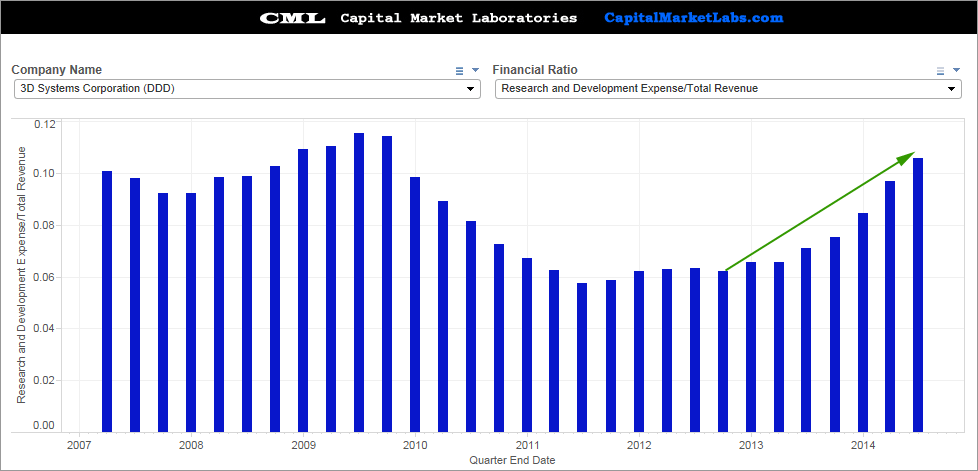
Research & Development (R&D) per Dollar of Revenue
We can see that DDD has substantially increased its investment (expenditures) in R&D from $0.06 out of every dollar in revenue to now $0.11 out of every dollar in revenue. That's a remarkable increase.
And now... the other side of the coin...
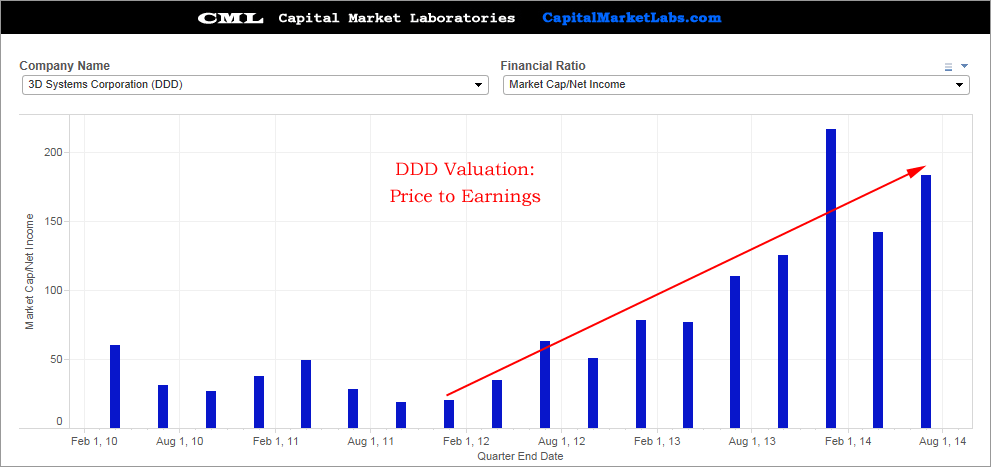
Valuation: Price to Earnings
Check out the trend in the P/E ratio. The stock market has been putting an expanding multiple on DDD earnings which suggests an anticipation of accelerating earnings growth. It's this chart, aside from everything else, that indicates the huge risk in the equity price if the firm missed earnings (or pre-announced).
You'll note that the peak in this measure coincides with the start of the equity collapse.
Make These Visualizations Yourself: Free Trial
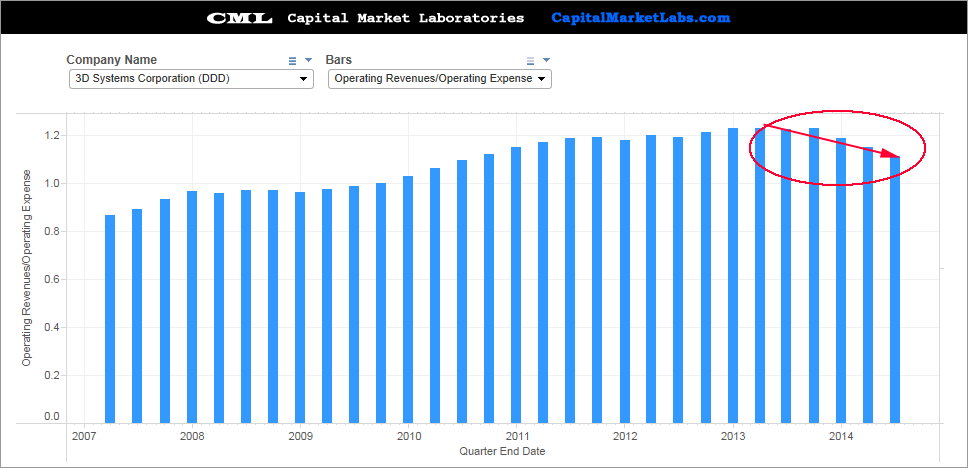
Operating Margin %
One of my favorite measures of all and perhaps the single most important is comparing operating revenue to operating expenses. Obviously a firm must have more than $1 in Op.Rev for every dollar in Op. Ex to be profitable.
We will see that DDD revenue has been booming... but the slip in this measure has crushed the net income margin %, and that in turn has crushed the stock price. Again, note that the peak in this measure and then the down trend coincides with the peak in stock price and then that downtrend.
It ain't magic... It's knowledge.
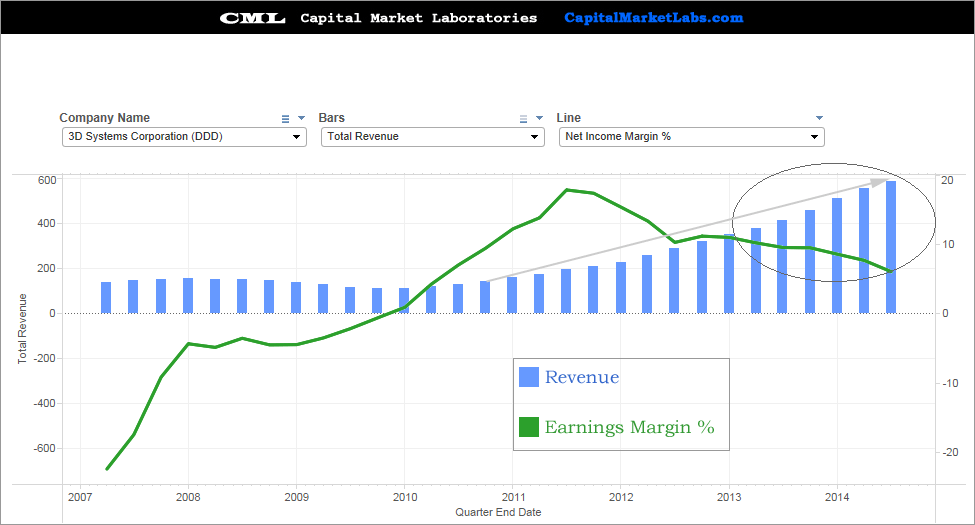
Revenue (TTM) to Earnings Margin % (TTM) Time Series
So this is the realization of the last chart. The blue bars represent DDD revenue and it has been booming quite impressively.
But.. the green line represents net income margin %, and that has been dropping significantly over the last year.
When a firm has this chart, and the chart above, and then the p/E chart (3 charts above), the stock goes down hard on bad news. That's what we see. That's what we saw.
Make These Visualizations Yourself: Free Trial
This is trade analysis, not a recommendation.
Follow @OphirGottlieb
Tweet
Legal Stuff:
Options involve risk. Prior to buying or selling an option, an investor must receive a copy of Characteristics and Risks of Standardized Options. Investors need a broker to trade options, and must meet suitability requirements.
The information contained on this site is provided for general informational purposes, as a convenience to the readers. The materials are not a substitute for obtaining professional advice from a qualified person, firm or corporation. Consult the appropriate professional advisor for more complete and current information. I am not engaged in rendering any legal or professional services by placing these general informational materials on this website.
I specifically disclaim any liability, whether based in contract, tort, strict liability or otherwise, for any direct, indirect, incidental, consequential, or special damages arising out of or in any way connected with access to or use of the site, even if I have been advised of the possibility of such damages, including liability in connection with mistakes or omissions in, or delays in transmission of, information to or from the user, interruptions in telecommunications connections to the site or viruses.
I make no representations or warranties about the accuracy or completeness of the information contained on this website. Any links provided to other server sites are offered as a matter of convenience and in no way are meant to imply that I endorse, sponsor, promote or am affiliated with the owners of or participants in those sites, or endorse any information contained on those sites, unless expressly stated.


No comments:
Post a Comment