| Tweet | Follow @OphirGottlieb |  |  |

This visualization is provided by:
Capital Market Laboratories: Get Notified When CML Light Goes Live
Conclusion
GS stock is up 3.7% in 2014, MS is up ~11.5% and LAZ is up 12.8%. If we throw in the large US banks (JPM +3%, C +0.25%, WFC +14% and BAC +11%) we see that GS is a relative under-performer, though certainly not the worst, it's near the bottom.
Further, GS has seen its revenue drop 30% over the last 4+ years which is the worst (by a lot) of all peers and its net income has dropped by nearly 50%, also, by far, the worst of any peer.
What's Going on at Goldman?
There are some troubling trends. I'll show four charts, all of which look... not so good...
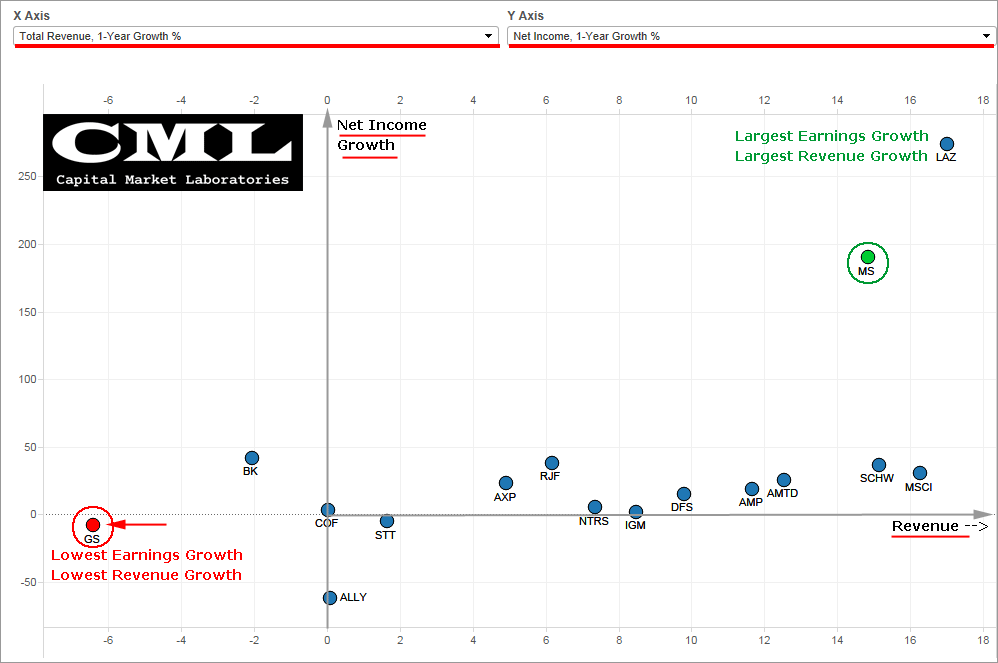
Revenue, 1-year Growth on the x-axis and Earnings, 1-Year Growth on the y-axis, we can see GS is simply... the worst of this peer group (yes the peer group is imperfect).
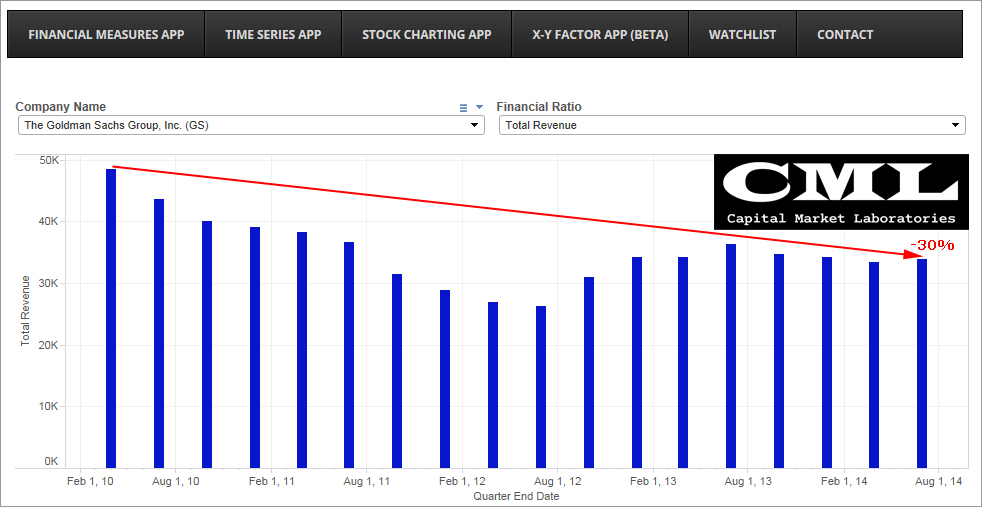
Total Revenue (TTM)
Over the last 4+ years, GS has seen revenue drop 30%. For comparison sake, MS has seen a 15% rise in revenue.
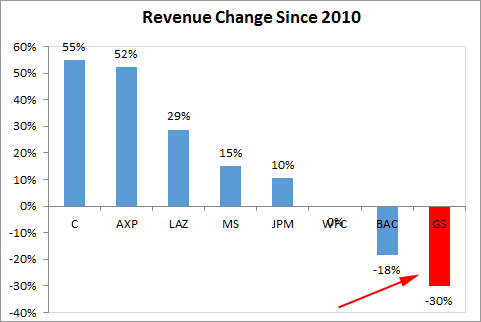
Peer Comp: Revenue Since 2010
Here are some relevant peers during that same time period, and their revenue changes. GS is by far the worst.
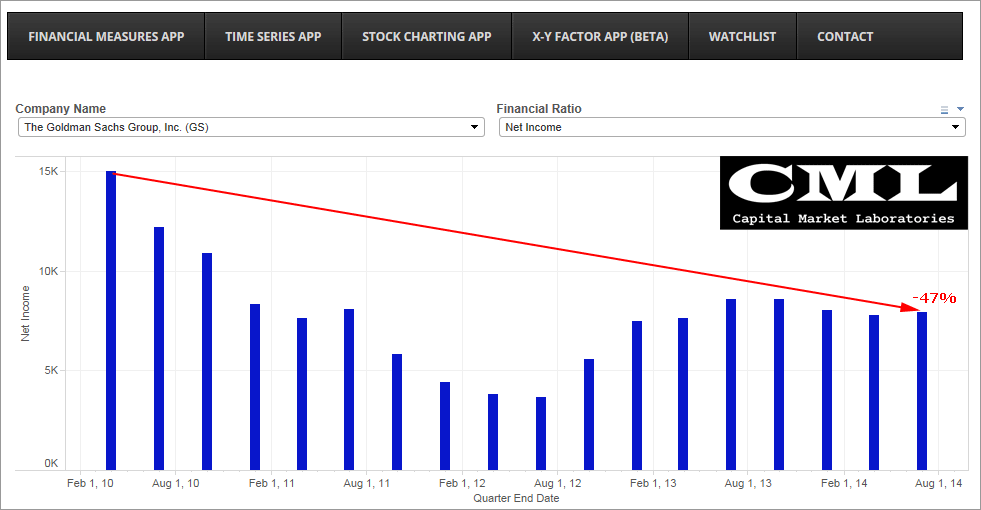
Net Income (TTM)
Over the same time period, GS has seen net income drop nearly 50%. In this same time period, MS net income has risen 33%, LAZ has gone from a loss to a $280 profit and BAC is up over 50%
Peer Comp: Revenue Since 2010
Here are some relevant peers during that same time period, and their net income changes. GS is by far the worst. Note that C saw a 600%+ rise and is not pictured so the chart doesn't get out of whack, and LAZ went from a loss to a $280M gain (impossible to calculate a percentage gain).

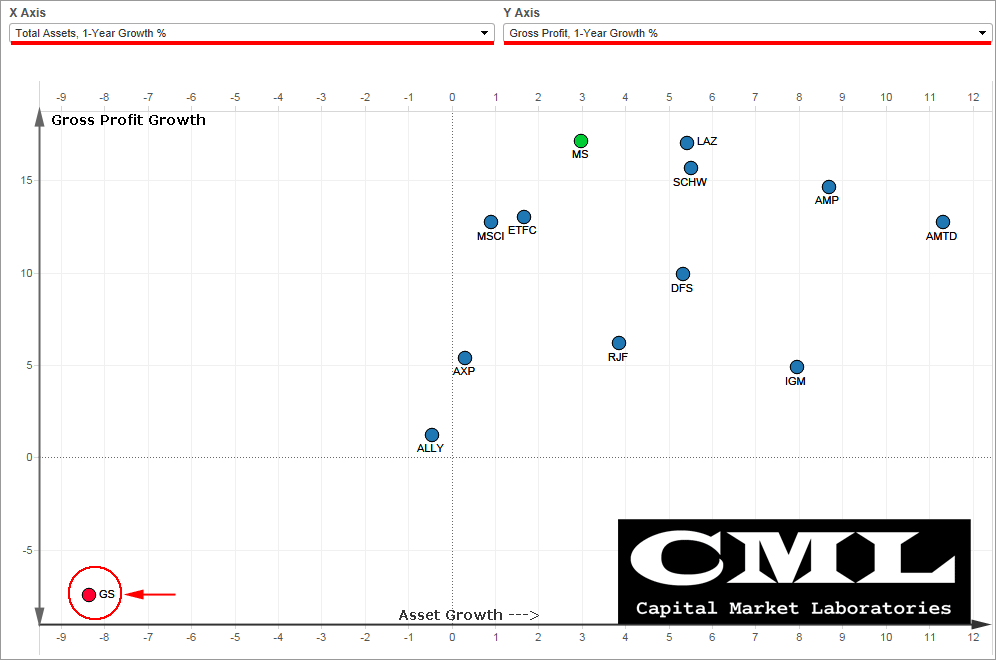
The last chart may be the most disturbing. On the x-axis we have Asset Growth, 1-Year and on the y-axis we have Gross Profit Growth, 1-Year. We can see that GS is essentially on a different chart than the rest of the peers.
This is trade analysis, not a recommendation.
Follow @OphirGottlieb
Tweet
Legal Stuff:
Options involve risk. Prior to buying or selling an option, an investor must receive a copy of Characteristics and Risks of Standardized Options. Investors need a broker to trade options, and must meet suitability requirements.
The information contained on this site is provided for general informational purposes, as a convenience to the readers. The materials are not a substitute for obtaining professional advice from a qualified person, firm or corporation. Consult the appropriate professional advisor for more complete and current information. I am not engaged in rendering any legal or professional services by placing these general informational materials on this website.
I specifically disclaim any liability, whether based in contract, tort, strict liability or otherwise, for any direct, indirect, incidental, consequential, or special damages arising out of or in any way connected with access to or use of the site, even if I have been advised of the possibility of such damages, including liability in connection with mistakes or omissions in, or delays in transmission of, information to or from the user, interruptions in telecommunications connections to the site or viruses.
I make no representations or warranties about the accuracy or completeness of the information contained on this website. Any links provided to other server sites are offered as a matter of convenience and in no way are meant to imply that I endorse, sponsor, promote or am affiliated with the owners of or participants in those sites, or endorse any information contained on those sites, unless expressly stated.


No comments:
Post a Comment