| Tweet | Follow @OphirGottlieb |  |  |

This visualization is provided by:
Make These Visualizations Yourself: Free Trial
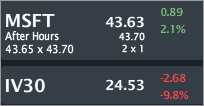
MSFT closed trading at $43.63, up 2.1% with IV30™ down 9.8%. The Symbol Summary is included below.
Provided by Livevol
Conclusion
Unlike many of the other technology stocks reporting earnings in the near-term, MSFT risk as reflected by the option market does not seem to have fallen into a malaise, rather it is elevate to what appears to be an appropriate level.
There are some very good things going on with MSFT, like gaming, cloud services and a free call option on any growth in the tablet realm with Surface. There are also some disturbing trends surrounding margins. Ultimately the stock has outperformed the S&P 500 and NASDAQ 100 and pays a nice dividend as well. I'll focus on the risk into earnings and some key metrics that analysts will focus on when earnings are released on 10-23-2014 (after market close).
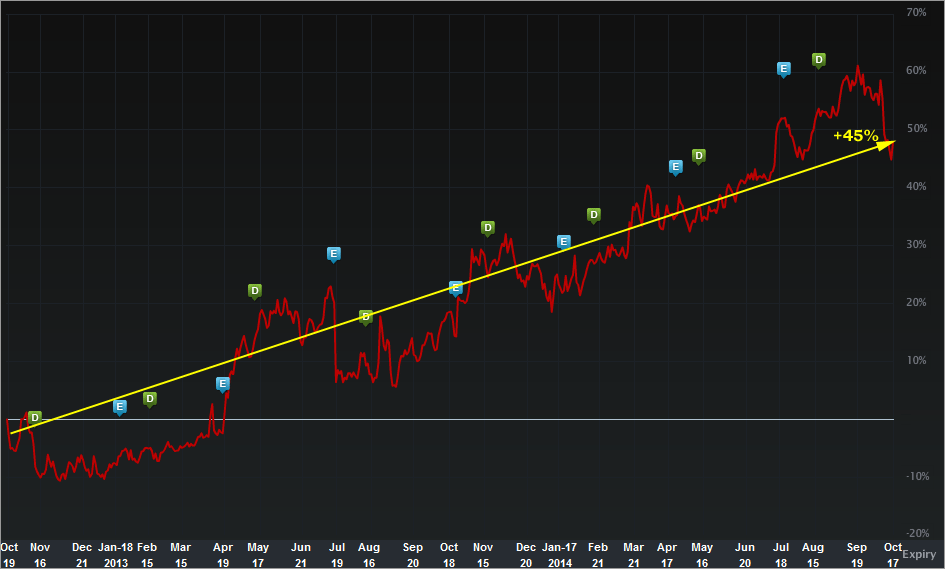
The two-year stock return chart is included below.
Provided by Livevol
MSFT is up 45% over the last two-years while SPX is up ~28% and the NASDAQ 100 is up ~37%. The recent drop seems to be systematic risk rather than firm specific. But fear not, firm specific risk will be realized once earnings are released in a week.
Let's turn to the financial measures that analysts will focus on in the earnings release and then turn to risk pricing by the option market.
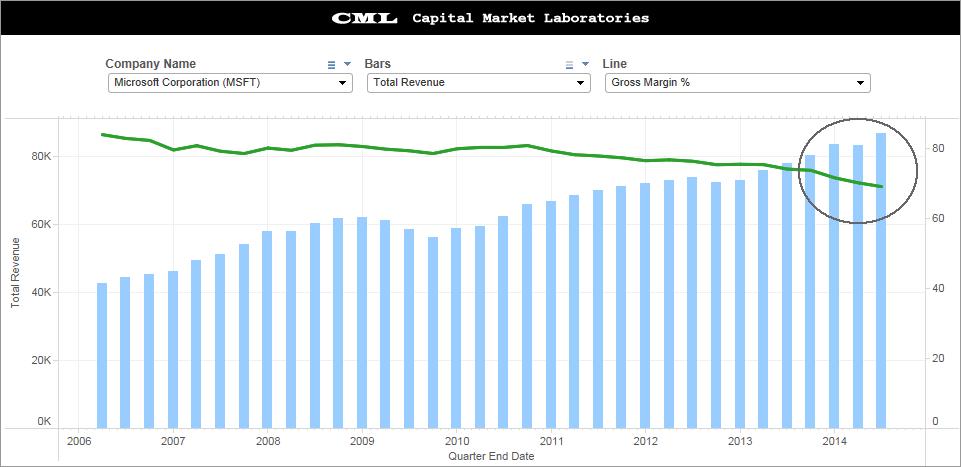
Revenue (TTM) vs. Gross Margin %
This is a good news / bad news chart for MSFT. Revenue (the blue bars) is growing, and has been growing basically... forever and for the trailing-twelve-months is at an all-time high.
But, gross margin % (green line) has been declining as revenue has been growing. That number (gross margin %) will be one of the few hyper focus points of this earnings release.
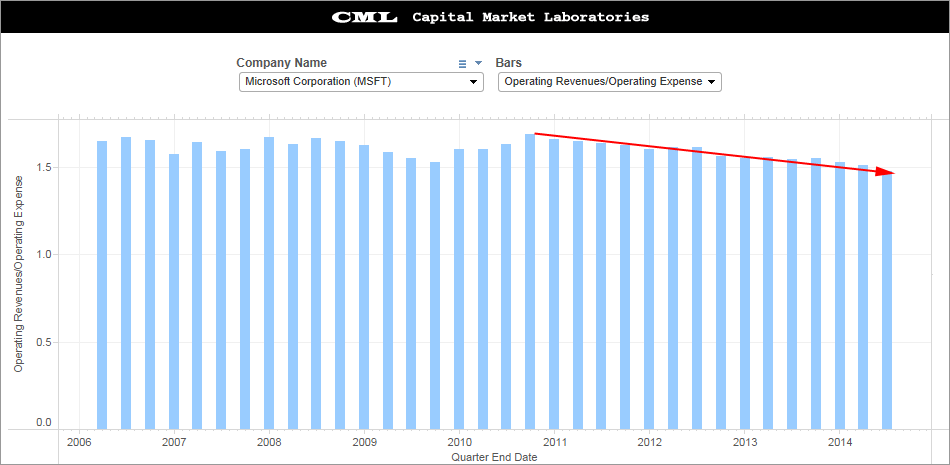
Operating Revenue / Operating Expenses
This is a great measure because it incorporates gross margin % and SG&A margin % into one measure. If this number rises with revenue, earnings pop, if this number dives, earnings will not be fully realized even with revenue growth.
This measure has lots of names and gets twisted and turned, but ultimately, if for every dollar of operating expense, MSFT can generate $1.55 in operating revenue (that's a very lofty number), the stock should react well (very well?) off of earnings, as long as forward looking forecasts don't dampen the mood. Watch this number.
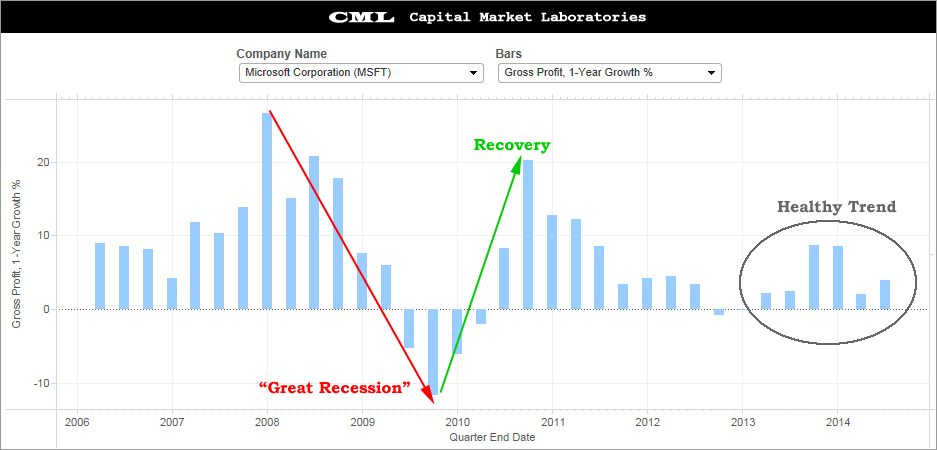
Gross Profit, 1-Year Growth
This is a one-year change time series, so think about hat a second before examining. We can see the dramatic year-over-year decline during the great recession, then a wonderful recovery. but, it's actually the recent trend which is quite healthy. MSFT is a giant, if it can keep growing (bars are positive), that's actually a non-trivial feat.
If MSFT can grow gross margin profit by 10% (that's a crazy high number), the stock should pop. In fact, even an 8% y-o-y number should push the stock higher (again, assuming forward looking forecasts don't dampen the quarterly results).
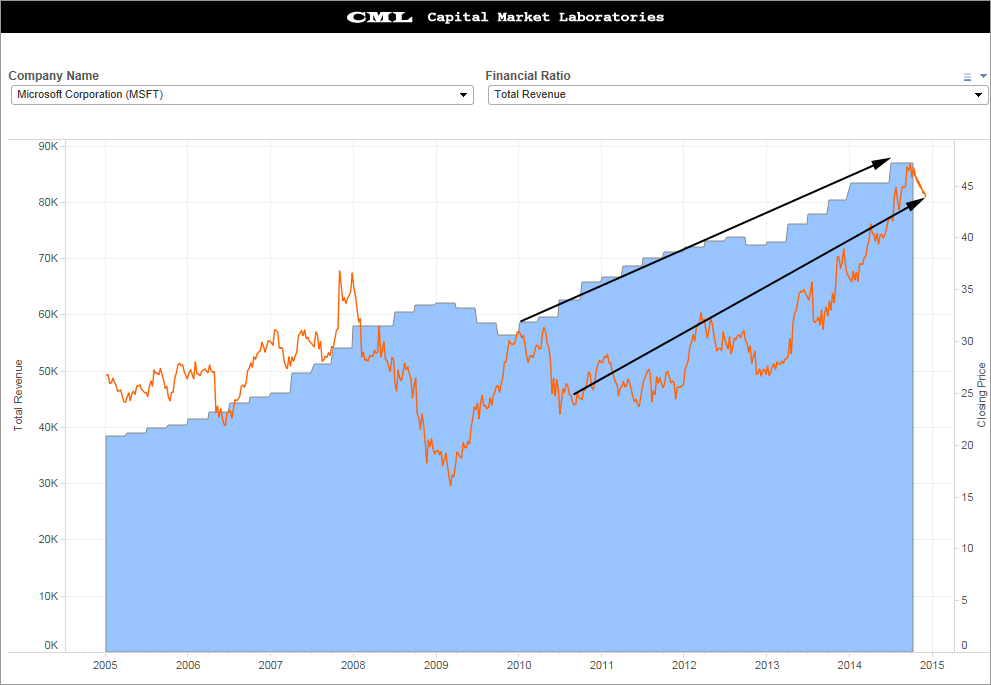
Stock Price to Revenue
Well, sometimes when you look at stock price vs. a financial measure you just gotta scratch your head and ask, "is it that easy?"
The blue fill is total revenue, and the orange line is stock price. For the last four years, the two have moved together essentially linearly. Of course, correlation does not imply causality, but hey, that ain't the worst measure of valuation I've ever seen.
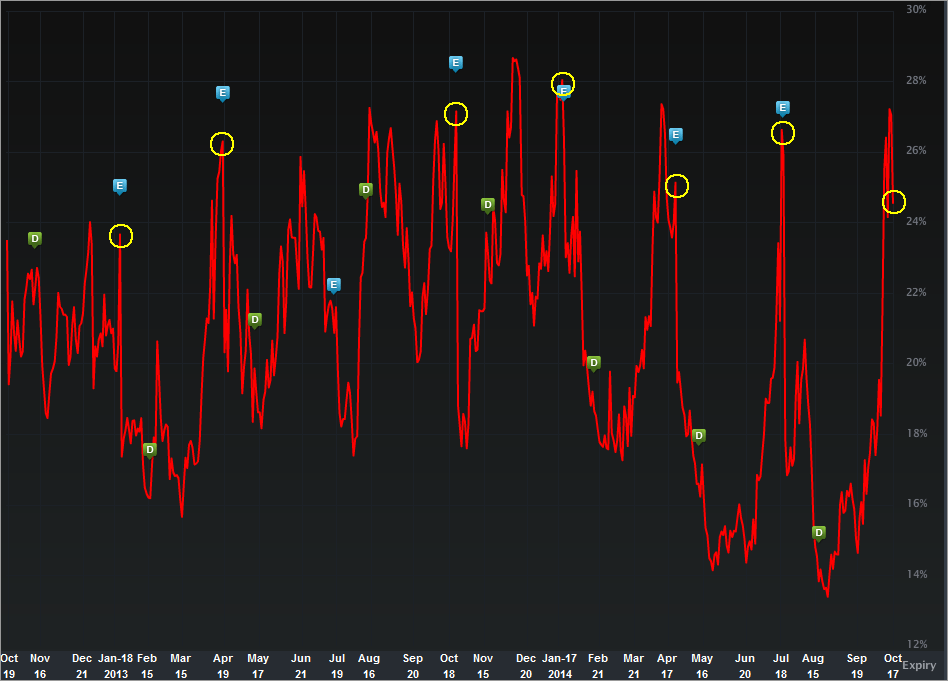
Now let's turn back to risk. The IV30™ chart in isolation, below.
Provided by Livevol
The implied volatility is the forward looking risk in the equity price as reflected by the option market (IV30™ looks forward exactly 30 calendar days).
In English, the red curve is the risk in future stock price movement. The blue E" icons represent earnings releases and we can see that the current level is very much in line with the recent past. So, basically, MSFT earnings risk looks about fair value if we use the past as an indicator of the future.
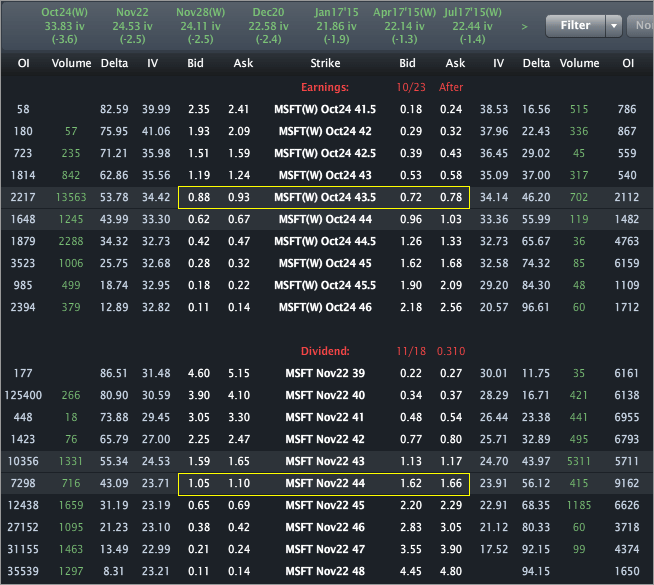
Finally, the Options Tab is included below.
Provided by Livevol
Using the at-the-money (ATM) straddle we can see that the option market reflects a price range of [$42, $45] by the end of trading on October 24th.
Going out to the November expiry options we see a range of [$41.30, $46.70] by the end of trading on Nov. 21st.
- If you believe the stock will be outside that range on expiry or any date before then, then you think the volatility is too low.
- If you believe that range is too wide, and that the stock will definitively be in that range on expiration, then you think volatility is too high.
- If you're not sure, and can make an argument for either case, then you think volatility is priced just about right.
This is trade analysis, not a recommendation.
Follow @OphirGottlieb
Tweet
Legal Stuff:
Options involve risk. Prior to buying or selling an option, an investor must receive a copy of Characteristics and Risks of Standardized Options. Investors need a broker to trade options, and must meet suitability requirements.
The information contained on this site is provided for general informational purposes, as a convenience to the readers. The materials are not a substitute for obtaining professional advice from a qualified person, firm or corporation. Consult the appropriate professional advisor for more complete and current information. I am not engaged in rendering any legal or professional services by placing these general informational materials on this website.
I specifically disclaim any liability, whether based in contract, tort, strict liability or otherwise, for any direct, indirect, incidental, consequential, or special damages arising out of or in any way connected with access to or use of the site, even if I have been advised of the possibility of such damages, including liability in connection with mistakes or omissions in, or delays in transmission of, information to or from the user, interruptions in telecommunications connections to the site or viruses.
I make no representations or warranties about the accuracy or completeness of the information contained on this website. Any links provided to other server sites are offered as a matter of convenience and in no way are meant to imply that I endorse, sponsor, promote or am affiliated with the owners of or participants in those sites, or endorse any information contained on those sites, unless expressly stated.


No comments:
Post a Comment