| Tweet | Follow @OphirGottlieb |  |  |

This visualization is provided by:
Make These Visualizations Yourself: Free Trial
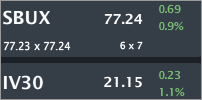
SBUX is trading $77.24, up 0.9% with IV30™ up 1.1%. The Symbol Summary is included below.
Provided by Livevol
Conclusion
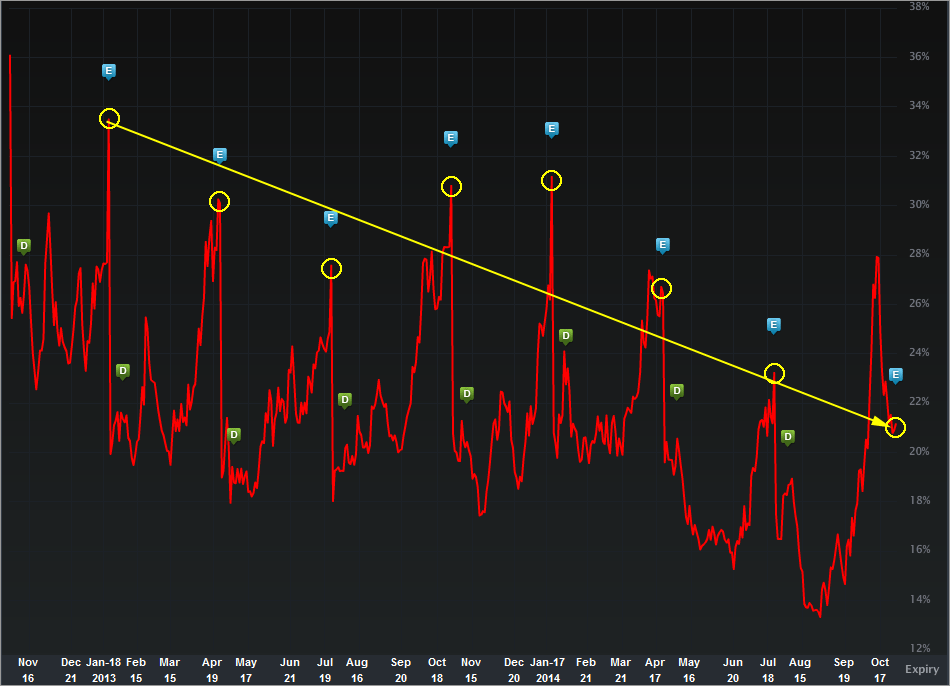
SBUX has earnings out in about an hour and a half. The option market is pricing in less risk for this release than any prior earnings release in the last eight quarters while the price to sales valuation has been rising quickly and abruptly with rising revenue. Is the risk in the option market too low?
Let's start with the financial measures before we get to risk pricing.
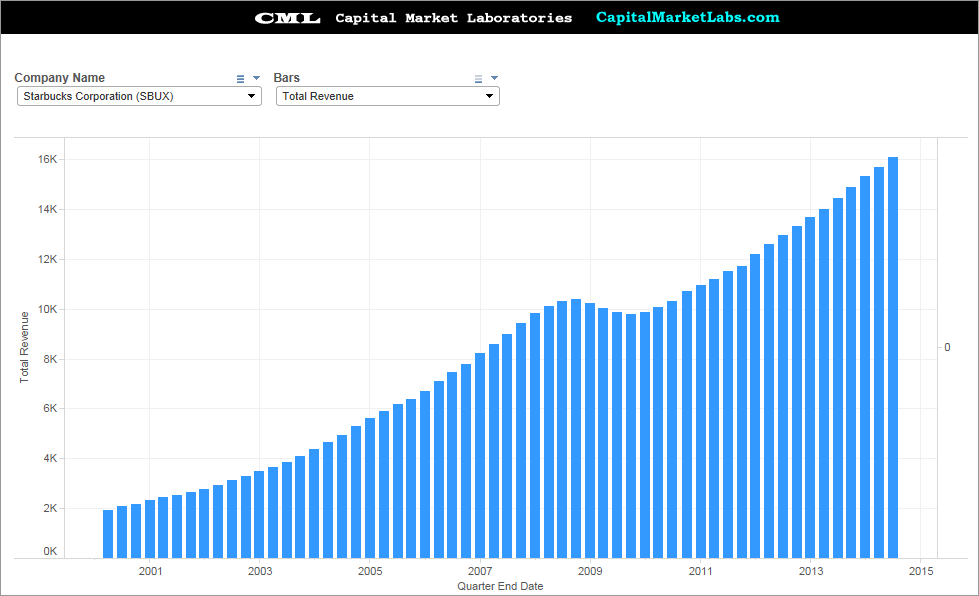
Revenue (TTM)
This is a beautiful chart and we can see how SBUX revenue has been booming for over a decade now.
Make these charts yourself: Free Trial of CML
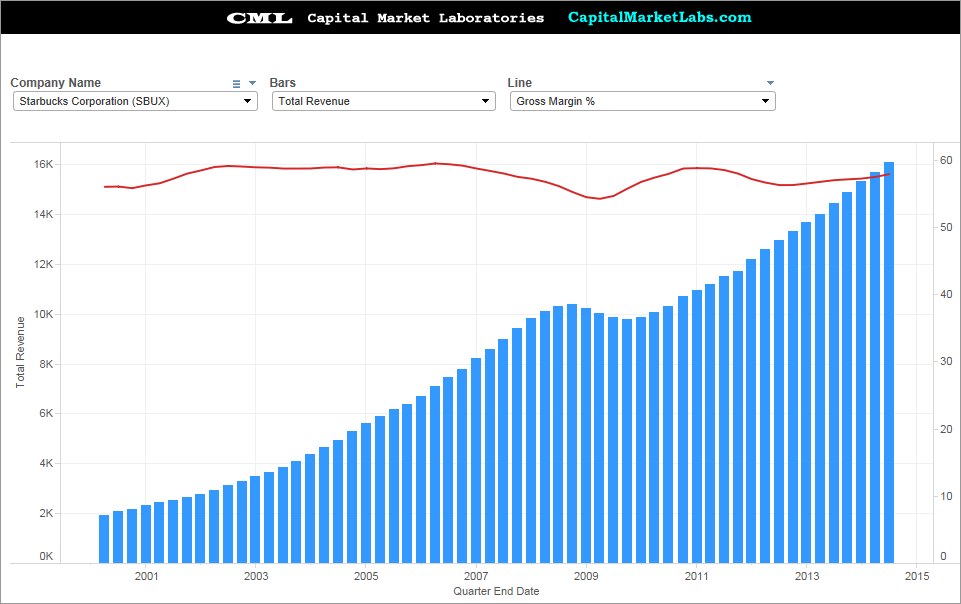
Revenue (TTM) vs. Gross Margin %
A critical measure to watch as a company grows its revenue is the consistency (or lack of) in gross margin %. i have added the red line to the revenue chart (blue bars) and we can see SBUX has done a remarkably good job at maintaining steady gross margin % as revenues grow. And by the way, the gross margin % is huge...
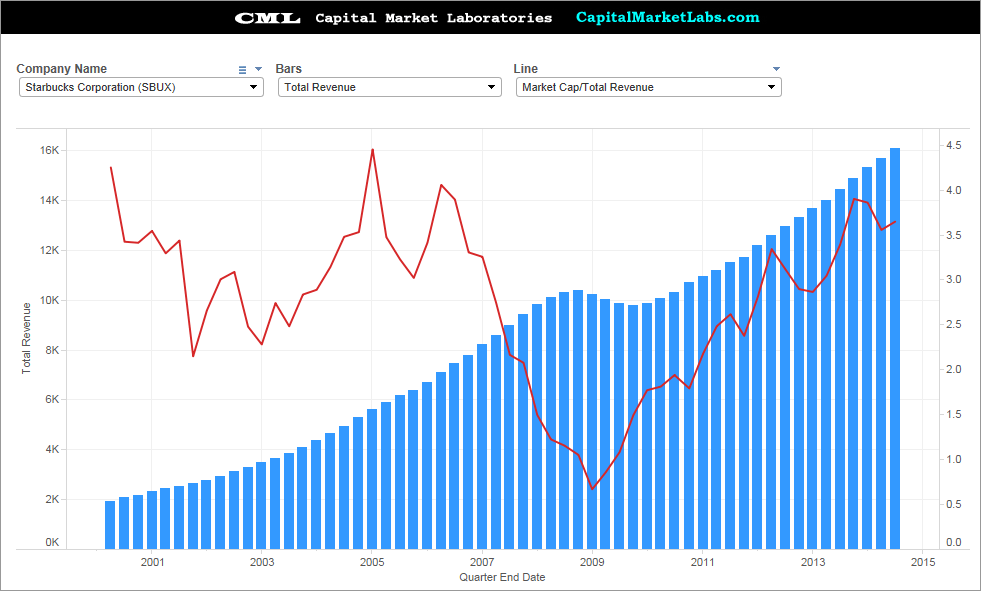
Revenue (TTM) to Valuation (Price to Sales Ratio)
This time I have added the price to sales trend (red chart), and we can see something quite interesting. As revenue have increased since 2009, so has the valuation (the multiple) on revenue. This indicates a positive outlook toward accelerating growth (in earnings and sales). Thus far, that trend has not "really" been broken, but, IMHO, this does point toward risk into this earnings release.
Make these charts yourself: Free Trial of CML
SBUX better hit its numbers and its forecasts for the future or there could be a spasm down in the stock price. Alternatively, a blow out quarter will push this valuation measure higher, b/c believe it or not... it's not that high for its peer group.
Price to Sales vs. Peers
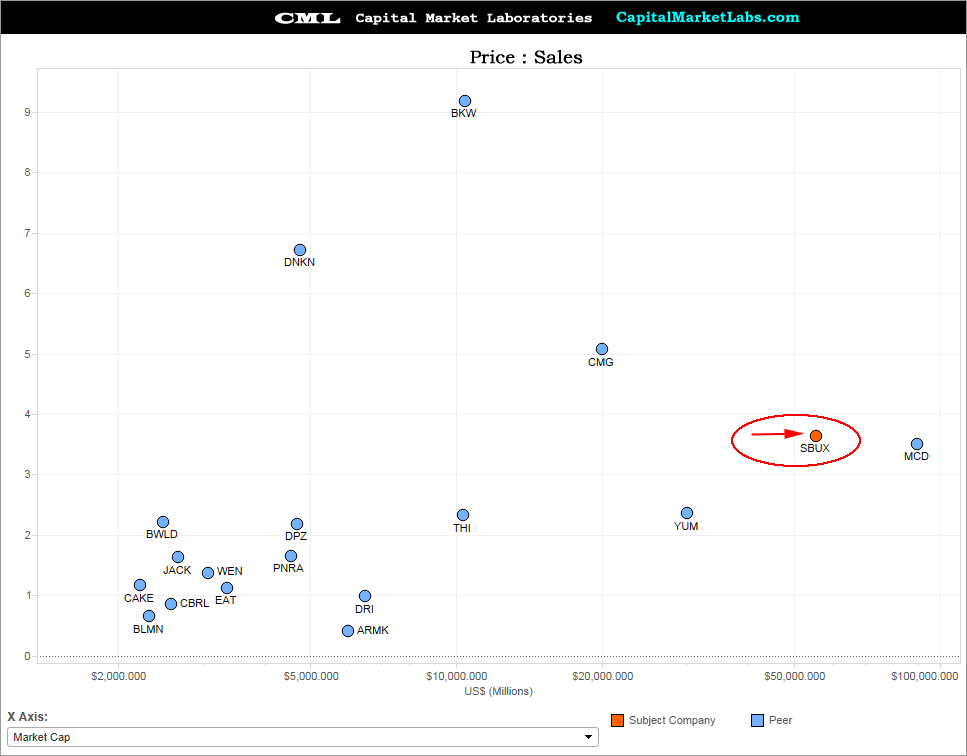
I have included SBUX peers in North America and the y-axis is Price to Sales (x-axis is market cap), We can see that while SBUX price to sales has been increasing of late (prior chart), as of right now, it's certainly not "unusual" relative to peers. An expansion of the price to sales ratio is possible, as is a shrinkage. This is a big earnings release.
Make these charts yourself: Free Trial of CML
Speaking of risk... Let's turn to the IV30™ chart in isolation, below.
Provided by Livevol
The implied volatility is the forward looking risk in the equity price as reflected by the option market (IV30™ looks forward exactly 30 calendar days).
In English, the red curve is the risk in future stock price movement. the blue "E" icons represent prior earnings periods and we can see, rather surprisingly (to me) that the risk priced into this earnings release is lower than nay other in the last 2 years. Hmm...
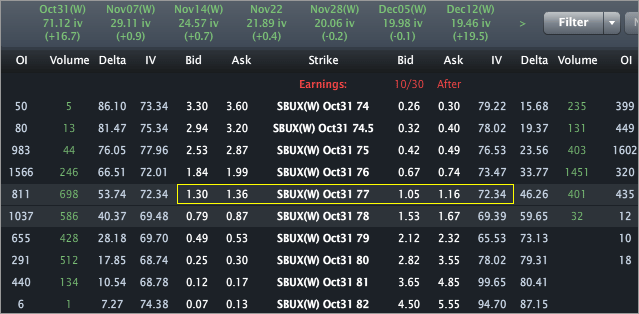
Finally, the Options Tab is included below.
Provided by Livevol
Using the at-the-money (ATM) straddle we can see that the option market reflects a price range of [$74.50, $79.50] by the end of trading on October 31st.
- If you believe the stock will be outside that range on expiry or any date before then, then you think the volatility is too low.
- If you believe that range is too wide, and that the stock will definitively be in that range on expiration, then you think volatility is too high.
- If you're not sure, and can make an argument for either case, then you think volatility is priced just about right.
This is trade analysis, not a recommendation.
Follow @OphirGottlieb
Tweet
Legal Stuff:
Options involve risk. Prior to buying or selling an option, an investor must receive a copy of Characteristics and Risks of Standardized Options. Investors need a broker to trade options, and must meet suitability requirements.
The information contained on this site is provided for general informational purposes, as a convenience to the readers. The materials are not a substitute for obtaining professional advice from a qualified person, firm or corporation. Consult the appropriate professional advisor for more complete and current information. I am not engaged in rendering any legal or professional services by placing these general informational materials on this website.
I specifically disclaim any liability, whether based in contract, tort, strict liability or otherwise, for any direct, indirect, incidental, consequential, or special damages arising out of or in any way connected with access to or use of the site, even if I have been advised of the possibility of such damages, including liability in connection with mistakes or omissions in, or delays in transmission of, information to or from the user, interruptions in telecommunications connections to the site or viruses.
I make no representations or warranties about the accuracy or completeness of the information contained on this website. Any links provided to other server sites are offered as a matter of convenience and in no way are meant to imply that I endorse, sponsor, promote or am affiliated with the owners of or participants in those sites, or endorse any information contained on those sites, unless expressly stated.


No comments:
Post a Comment