| Tweet | Follow @OphirGottlieb |  |  |

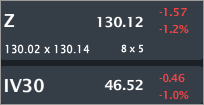
Z closed trading at $130.12, down 1.2% IV30™ down 1.0%. The Symbol Summary is included below.
Provided by Livevol
Disclosure: The hedge fund is short Zillow.
Conclusion
This is a quick note following some fundamental measures in Zillow (Z), some of which are:
* Strikingly good
* Strikingly bad
* Strikingly consistent
* Strikingly correlated to stock price
At some point, very soon in my opinion, Z will reach a cross roads, and the stock will move with earnings. For now, its moving with something else.
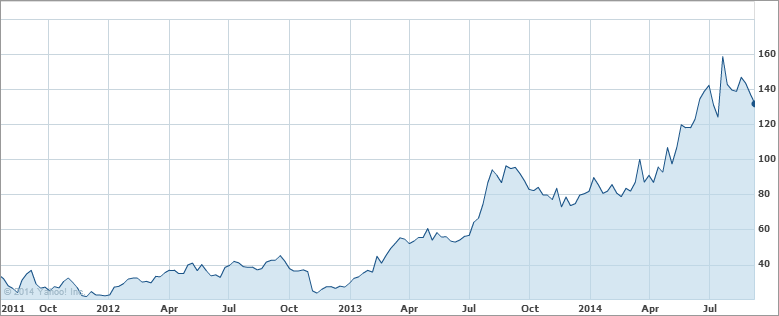
The stock chart is included below.
Provided by Yahoo! Finance
Easy enough... the stock has exploded up. It's now off of its highs, but still a huge MOMO return. Now it's time for the financial measures...
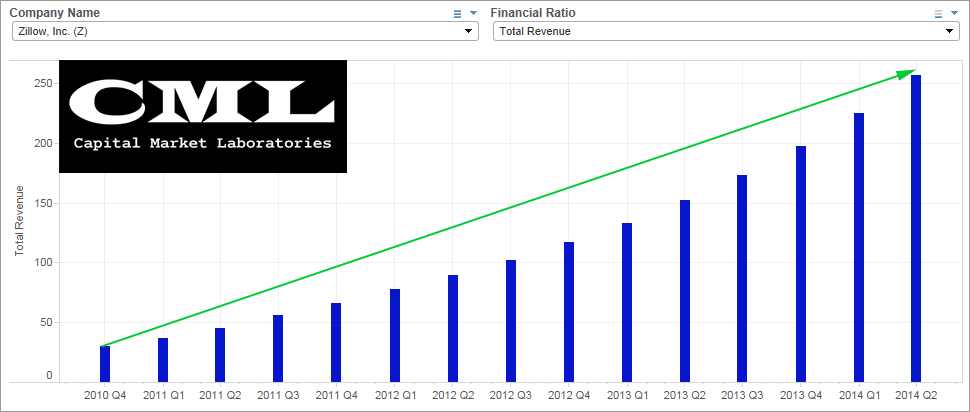
Revenue (TTM) - Strikingly Good
Revenue growth has been incredible, rising from ~$30M (ttm) to now over a quarter billion dollars. Remember this chart, we'll see it again in bit with some more 'flavor.'
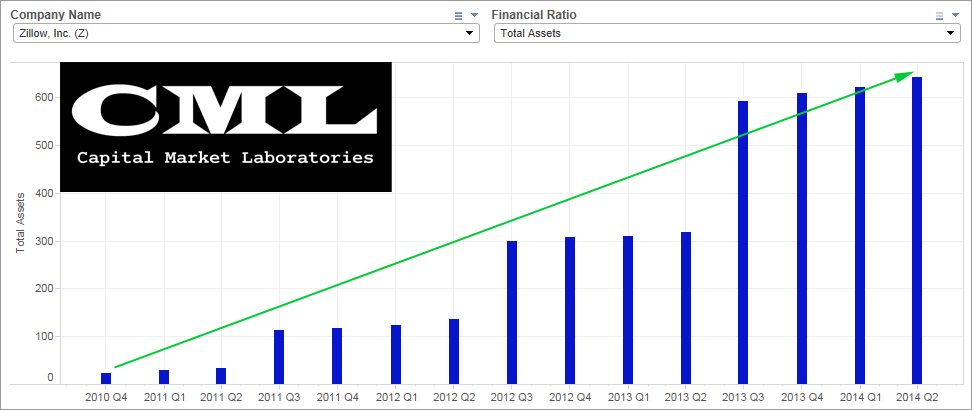
Total Assets - Strikingly Good
It's not just revenue that is exploding, but also total assets. The firm now carries over $600M of assets on its balance sheet.
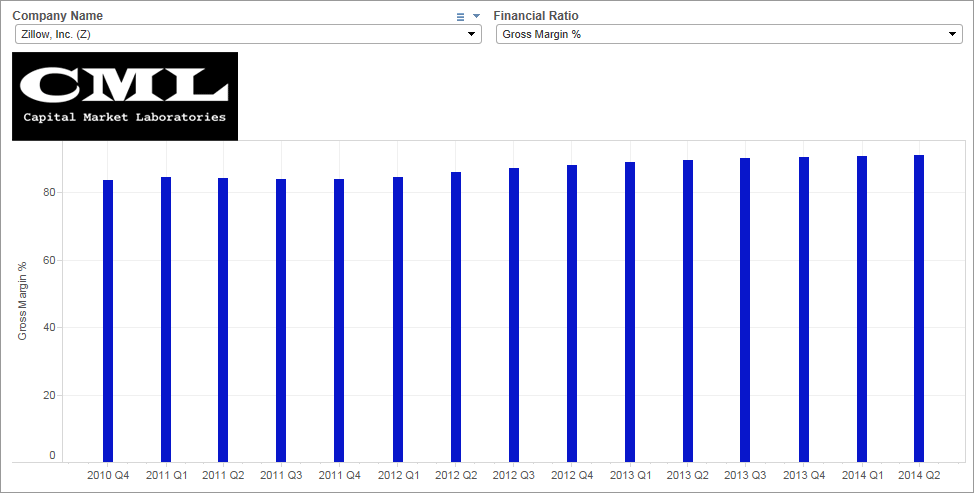
Gross Margin % - Strikingly Consistent
Z gross margin% has been consistent for quite some time and the level is very high. As of the current period we're looking at gross margin % of ~ 85%. That's phenomenal.
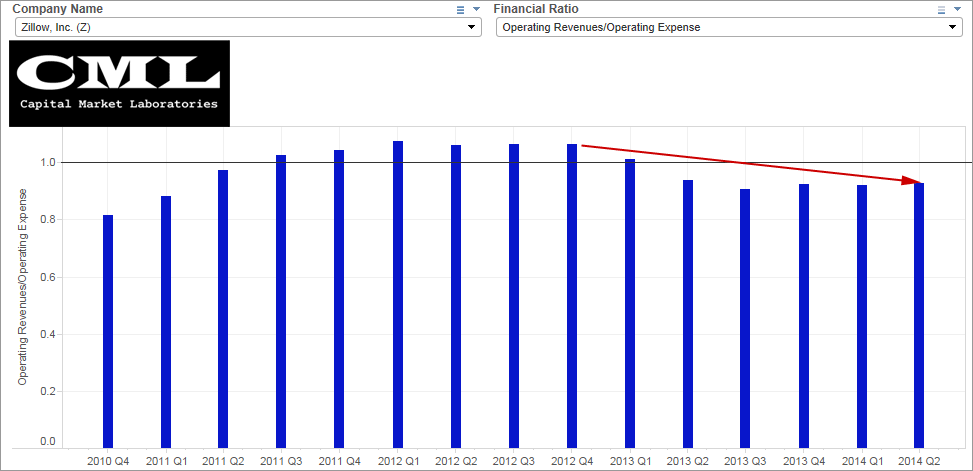
Operating Revenue / Operating Expenses - Strikingly Bad
This is one of my favorite measures, because it's so easy to understand. A firm must earn more than $1 in operating revenue for every dollar in operating expense in order to be profitable. We can see Z was above that magical threshold line, and now has fallen well below. The firm pays ~$1.10 for every $1 in revenue.
Net Income (Earnings) - Strikingly Bad... sort of
Z was showing a profit for several quarters, but has gone from a trailing twelve month net income high of ~$7M to now a loss of $15M. This is "sort of" bad for two reasons:
1. Both numbers are small.
2. This firm is focusing on growth, so the bottom line will be sacrificed... for a while.

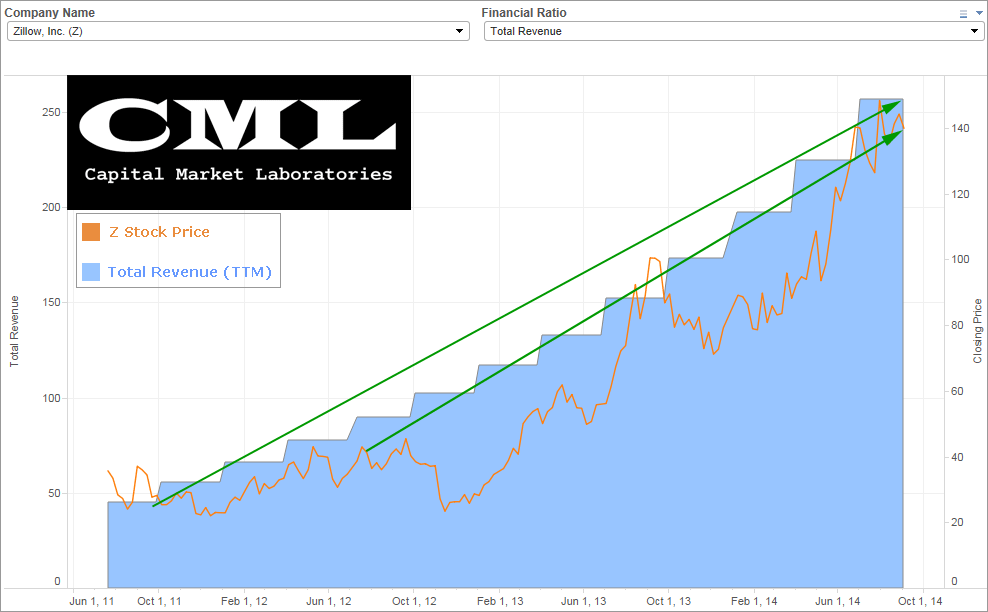
Total Revenue to Stock Price - Strikingly Correlated
The chart below shows us total revenue (blue) to stock price (orange). For now the stock market is valuing Z on its revenue growth. That will change at some point... and I believe that point is right around now.
This is trade analysis, not a recommendation.
Follow @OphirGottlieb
Tweet
Legal Stuff:
Options involve risk. Prior to buying or selling an option, an investor must receive a copy of Characteristics and Risks of Standardized Options. Investors need a broker to trade options, and must meet suitability requirements.
The information contained on this site is provided for general informational purposes, as a convenience to the readers. The materials are not a substitute for obtaining professional advice from a qualified person, firm or corporation. Consult the appropriate professional advisor for more complete and current information. I am not engaged in rendering any legal or professional services by placing these general informational materials on this website.
I specifically disclaim any liability, whether based in contract, tort, strict liability or otherwise, for any direct, indirect, incidental, consequential, or special damages arising out of or in any way connected with access to or use of the site, even if I have been advised of the possibility of such damages, including liability in connection with mistakes or omissions in, or delays in transmission of, information to or from the user, interruptions in telecommunications connections to the site or viruses.
I make no representations or warranties about the accuracy or completeness of the information contained on this website. Any links provided to other server sites are offered as a matter of convenience and in no way are meant to imply that I endorse, sponsor, promote or am affiliated with the owners of or participants in those sites, or endorse any information contained on those sites, unless expressly stated.


No comments:
Post a Comment