| Tweet | Follow @OphirGottlieb |  |  |

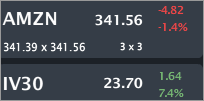
AMZN is trading $341.56, down 1.4% with IV30™ up 7.4%. The Symbol Summary is included below.
Provided by Livevol
This is a stock price, volatility and fundamental note on AMZN all delivered through the power of visual data.
Conclusion
AMZN is making a huge bet... and soon everyone will notice.
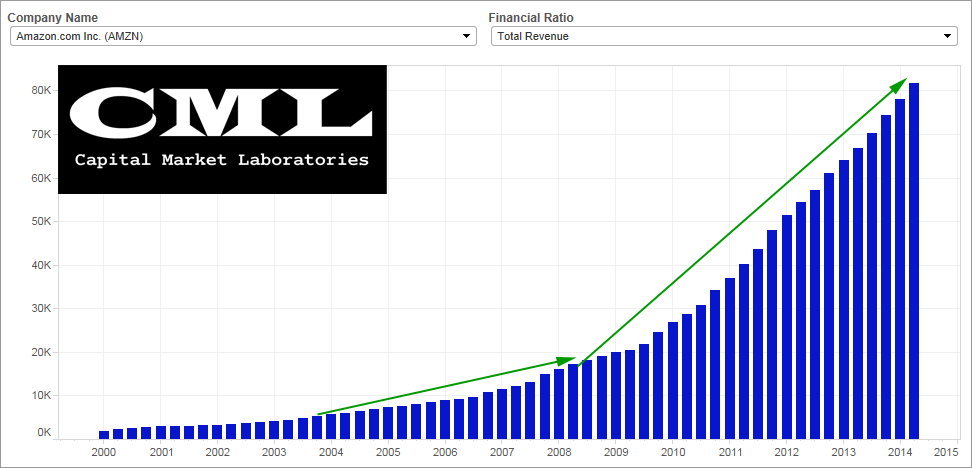
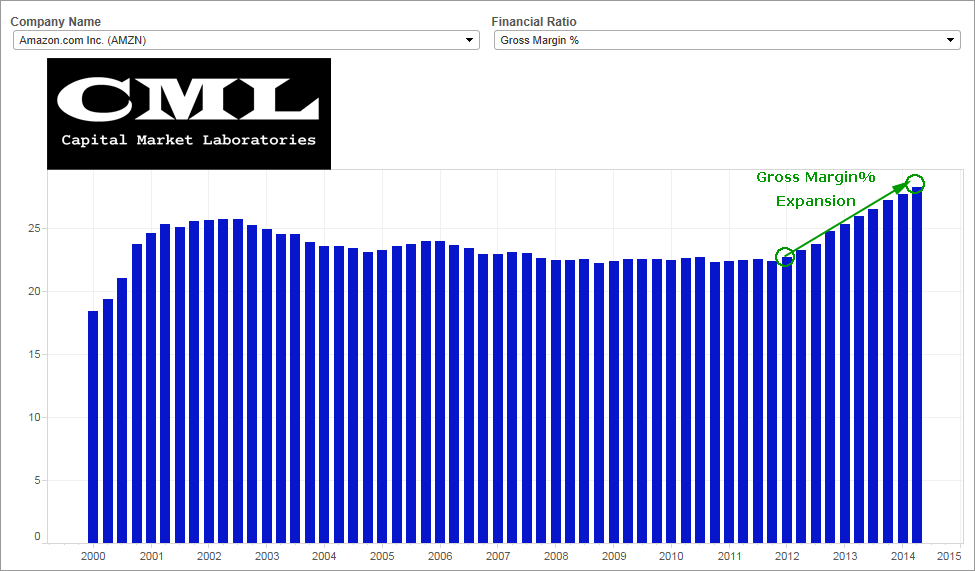
AMZN revenue has been exploding since it went public and continues to explode today. In fact, it's one of the most breathtaking time series charts you'll ever see given the size of the firm. In the last few years the firm is showing gross margin % expansion, which combined with revenue growth is the recipe for increasing earnings.
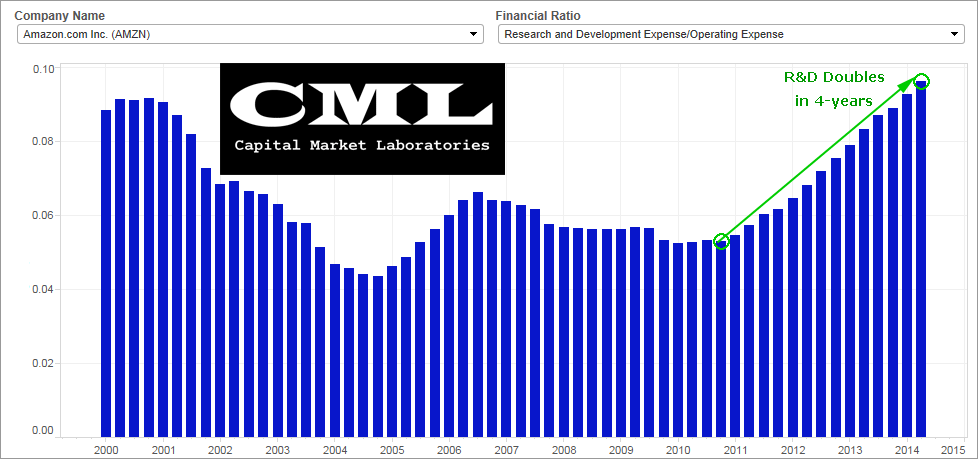
But earnings are not increasing... But there's a secret, it's known by a few, hidden by none, but rarely spoken about. AMZN is pouring money in Research & Development at a breathtaking pace relative to operating expenses. That means risk: either this R&D pays off and the firm's market gap expands rapidly, or AMZN never realizes its earnings potential and its $160B market cap could come into serious question.
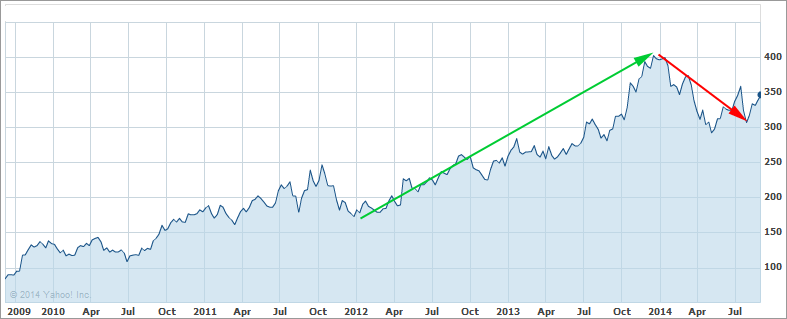
Let's start with the five-year stock chart.
Provided by Yahoo! Finance
AMZN stock price has risen from sub $100 to over $400 and then back down below $300 only now to find itself sitting at ~$350. The choppiness in the stock is both related to systematic risk (the MOMO moves) and firm specific risk -- is the firm going to be successful in all, some, or none of its new ventures taking on competitors like GOOGL and AAPL?
Let's turn to the financial measures and then the risk pricing via the option market.
Revenue
Here it is... the most remarkable chart for a $160B firm I have ever seen. The firm simply will not stop growing its revenue base. It's so impressive it fees like a mistake...
Gross Margin %
AMZN had found its equilibrium gross margin % and held it for about a decade... But a new trend has emerged since 2012... Check out that gross margin % expansion. That's almost unheard of for a firm as established as AMZN in the retail sales world.
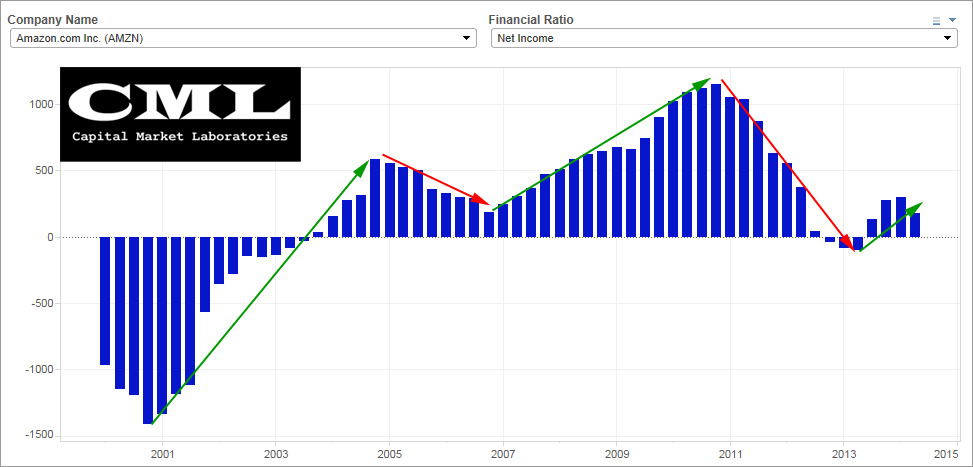
Net Income
After years of promise, AMZN broke into positive earnings territory in 2004. It stayed in positive earnings territory for nearly a decade, and then there was a linear, but abrupt drop in earnings to the point were the firm was again booking loses. That trend has been broken (ish), but AMZN is nowhere near the earnings level it had been, nor the level it must reach to justify its market cap.
Research & Development
So what's going on?... Check out the amount of money AMZN is spending on R&D. The firm went from spending ~$0.04 per dollar of operating expenses on R&D to now over $0.09. That's a gigantic change for a $160 billion firm.
If AMZN is unable to realize the vision of its CEO and founder Jeff Bezos, it won't be for lack of effort. This firm is not sitting around and watching, it's actively pursuing and competing.
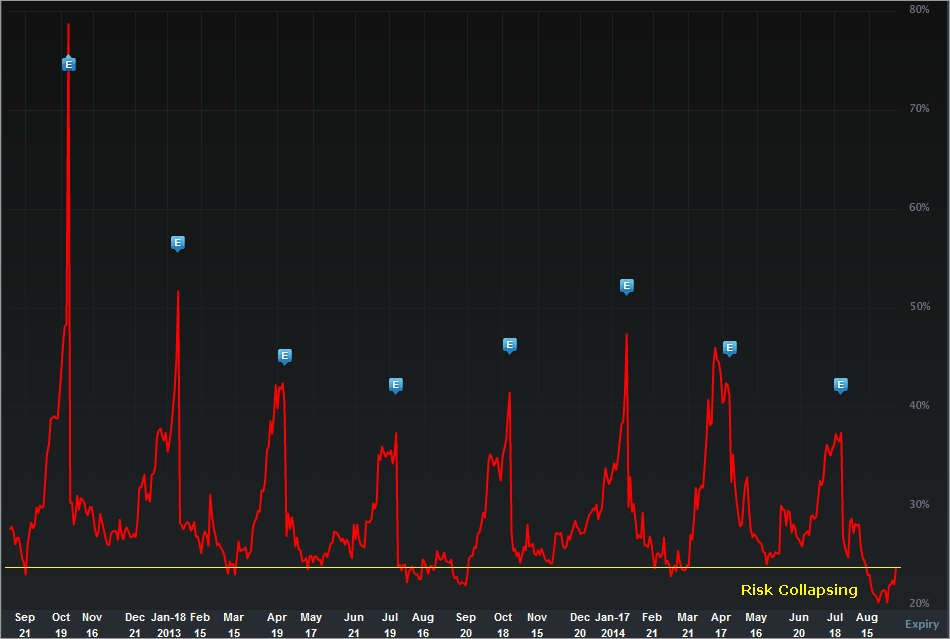
Now let's turn to the risk pricing. The IV30™ chart in isolation, below.
Provided by Livevol
The implied volatility is the forward looking risk in the equity price as reflected by the option market (IV30™ looks forward exactly 30 calendar days).
In English, the red curve is the risk in future stock price movement. I drew in that yellow line, so we can see explicitly how low the risk pricing is in the short-term for AMZN shares as reflected by the option market. Although we are looking at the short-term (30 days), if we look at the longer-term measures (up to 360 days), the implied volatility is low across the board.
Is this firm really at equilibrium and now at a low risk stage of its development?
Finally, the Options Tab is included below.

Provided by Livevol
Using the at-the-money (ATM) straddle we can see that the option market reflects a price range of [$329, $351] by the end of trading on Sep 19th.
We can see a price range of [$319, $361] by the end of trading on Oct 17th.
- If you believe the stock will be outside that range on expiry or any date before then, then you think the volatility is too low.
- If you believe that range is too wide, and that the stock will definitively be in that range on expiration, then you think volatility is too high.
- If you're not sure, and can make an argument for either case, then you think volatility is priced just about right.
This is trade analysis, not a recommendation.
Follow @OphirGottlieb
Tweet
Legal Stuff:
Options involve risk. Prior to buying or selling an option, an investor must receive a copy of Characteristics and Risks of Standardized Options. Investors need a broker to trade options, and must meet suitability requirements.
The information contained on this site is provided for general informational purposes, as a convenience to the readers. The materials are not a substitute for obtaining professional advice from a qualified person, firm or corporation. Consult the appropriate professional advisor for more complete and current information. I am not engaged in rendering any legal or professional services by placing these general informational materials on this website.
I specifically disclaim any liability, whether based in contract, tort, strict liability or otherwise, for any direct, indirect, incidental, consequential, or special damages arising out of or in any way connected with access to or use of the site, even if I have been advised of the possibility of such damages, including liability in connection with mistakes or omissions in, or delays in transmission of, information to or from the user, interruptions in telecommunications connections to the site or viruses.
I make no representations or warranties about the accuracy or completeness of the information contained on this website. Any links provided to other server sites are offered as a matter of convenience and in no way are meant to imply that I endorse, sponsor, promote or am affiliated with the owners of or participants in those sites, or endorse any information contained on those sites, unless expressly stated.


No comments:
Post a Comment