| Tweet | Follow @OphirGottlieb |  |  |

Visualizations for this article is provided by: Capital Market Laboratories
* More Articles: The Power of Visual Data
Over the last twelve-months the S&P 500 has risen 21%, while the less than sexy, less than momentum, less than headline grabbing Dow Jones Transports Index has have risen 35%. Some of the best performers in the transportation sector have been the airlines with American Airlines, Jet Blue, Delta Airlines and United Airlines realizing gains of 120%, 103%, 94% and 71%, respectively. But there’s one out-performer that beat even all of those.
Southwest Airlines (LUV) is up 151%, outperforming the S&P 500 by more than seven-fold, the transports by more than four-fold and even the rest of the airlines by at least 30% in just one-year.
Conclusion
LUV stock price has risen through a dramatic improvement in the underlying fundamental measures of the company. The end result is a remarkable realized equity return that moves in lock-step with the most rationale measure of all: earnings. Let’s look at three charts which demonstrate this phenomenon and a then a final chart which ties it all together.
Chart #1: Revenue
Revenue growth has been strong since 2009, but even in the last year, LUV has seen its total revenue (ttm) rise from $17.2B to $18.2B over the last year.
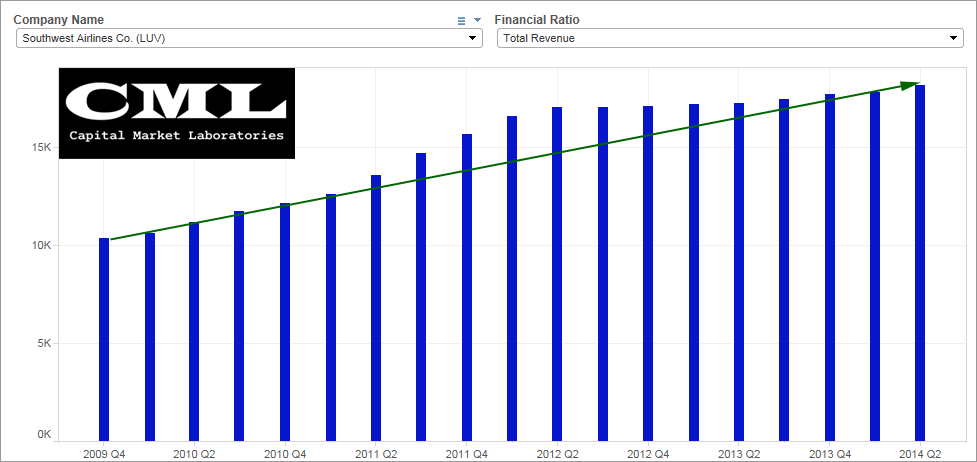
Chart #2: Gross Margin %
While LUV saw a rather dramatic decline in gross margin % from Q1 2011 to Q1 2012, the turnaround of late has been even more remarkable. In Q2 2013 the firm realized 21.9% gross margins and as of Q2 2013 the firm realized gross margins of over 27.2%, or a nearly 25% relative improvement in just five-quarters.
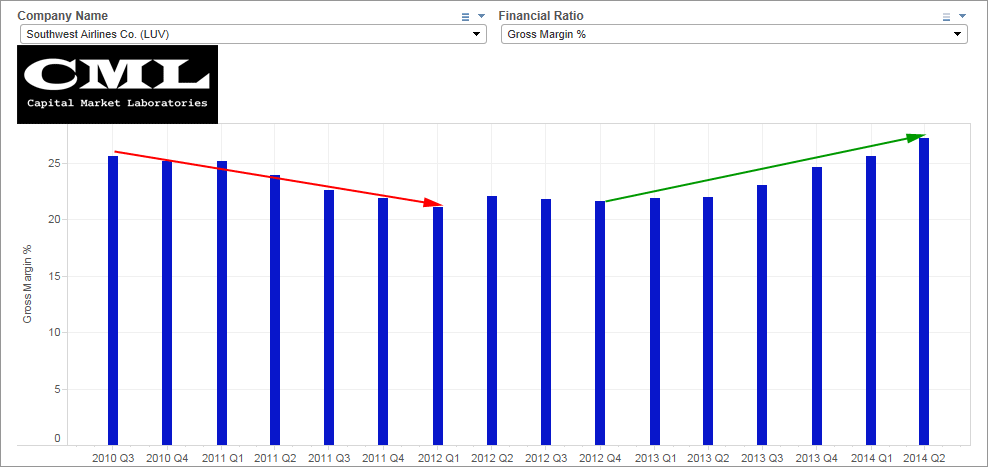
Chart #3 Operating Margins (Peer Group Comps)
One of my favorite measures of all is comparing operating revenue to operating expenses. Obviously a firm must have more than $1 in Op.Rev for every dollar in Op. Ex to be profitable. A big part of LUV's improving financial condition is the one-year improvement in this measure. Other than American Airlines (AAL), no other US airline has seen a greater operating margin improvement over the last year.
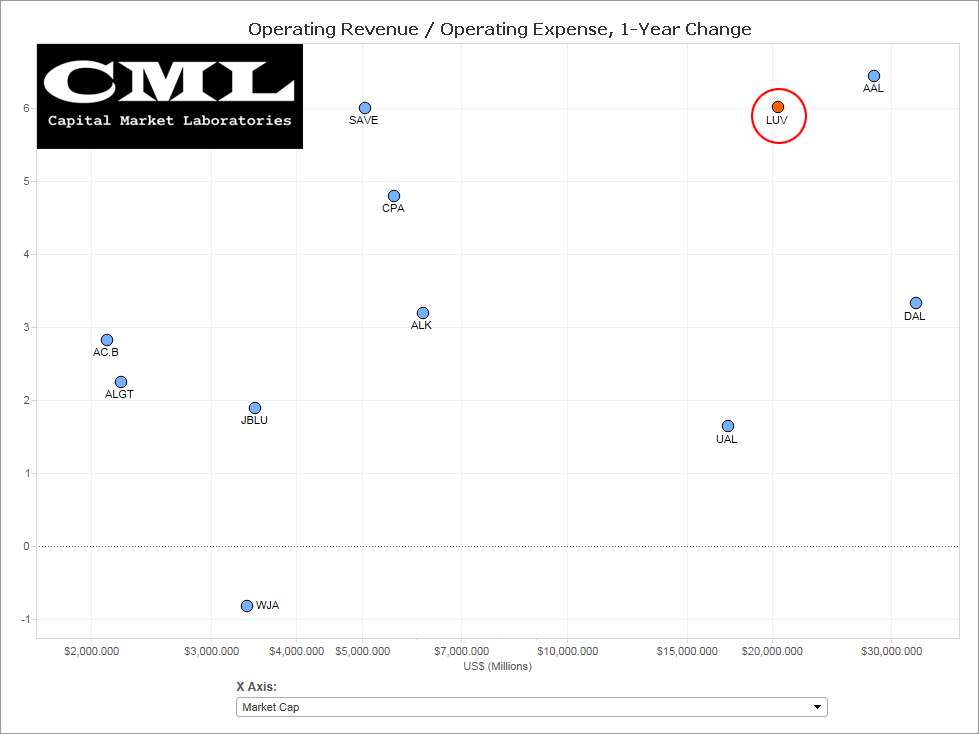
Chart #4: Net Income (Earnings)
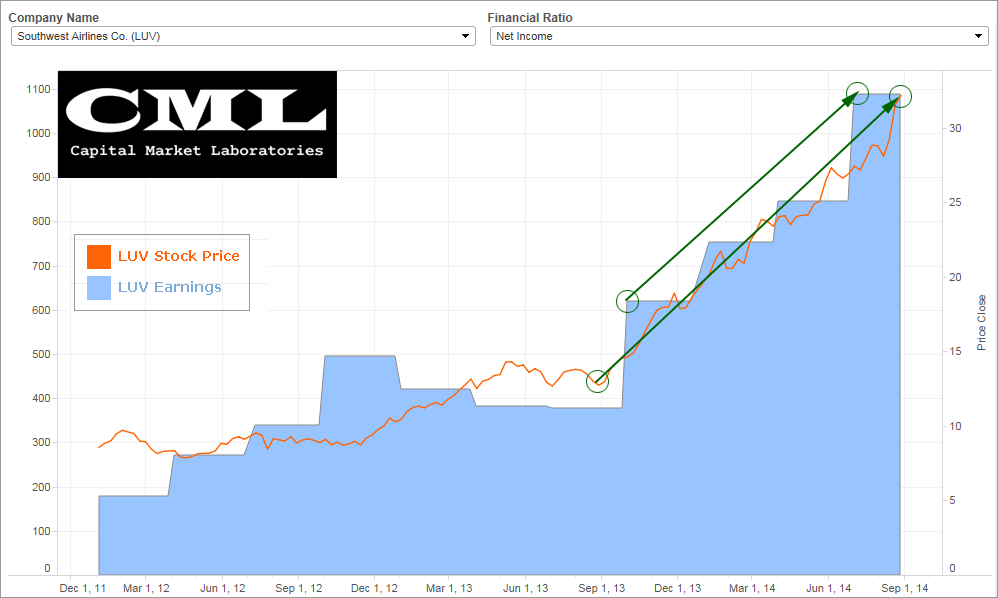
When revenue, gross margins and operating margins are increasing, earnings can’t be far behind. In a remarkable turnaround, LUV net income (ttm) rose from$377 million to now over $1 billion.
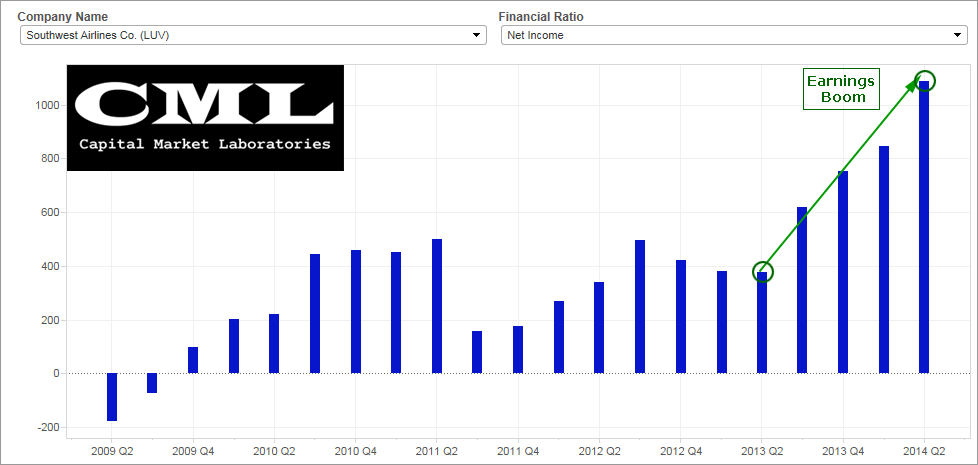
Chart #5: Stock Price to Net Income
Does the stock price reflect this earnings growth? Actually, yes it does… rather accurately. In the chart below we can see the dramatic rise in net income moves in lock step with the dramatic rise in the stock price.
This is trade analysis, not a recommendation.
Follow @OphirGottlieb
Tweet
Legal Stuff:
Options involve risk. Prior to buying or selling an option, an investor must receive a copy of Characteristics and Risks of Standardized Options. Investors need a broker to trade options, and must meet suitability requirements.
The information contained on this site is provided for general informational purposes, as a convenience to the readers. The materials are not a substitute for obtaining professional advice from a qualified person, firm or corporation. Consult the appropriate professional advisor for more complete and current information. I am not engaged in rendering any legal or professional services by placing these general informational materials on this website.
I specifically disclaim any liability, whether based in contract, tort, strict liability or otherwise, for any direct, indirect, incidental, consequential, or special damages arising out of or in any way connected with access to or use of the site, even if I have been advised of the possibility of such damages, including liability in connection with mistakes or omissions in, or delays in transmission of, information to or from the user, interruptions in telecommunications connections to the site or viruses.
I make no representations or warranties about the accuracy or completeness of the information contained on this website. Any links provided to other server sites are offered as a matter of convenience and in no way are meant to imply that I endorse, sponsor, promote or am affiliated with the owners of or participants in those sites, or endorse any information contained on those sites, unless expressly stated.


No comments:
Post a Comment