| Tweet | Follow @OphirGottlieb |  |  |
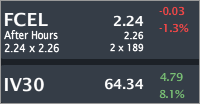
FCEL closed trading at $2.24, down small with IV30™ up 8.1%. The Symbol Summary is included below.
Provided by Livevol
FuelCell Energy, Inc. (FuelCell Energy) is a integrated fuel cell company. The Company designs, manufactures, sells, installs, operates and service ultra-clean, stationary fuel cell power plants for distributed baseload power generation.
This is a follow up to a story I posted on June 3rd, 2014
FuelCell (FCEL) - Earnings Postmortem & How This Growth Story Just Isn't... At All...
Conclusion
FCEL risk is dropping per the option market as the fundamentals of the firm fight to trend higher. We'll examine the fundamentals in five charts and ultimately come to the conclusion that something must change for this firm. It will either grow and succeed or it will not and either get bought out or simply go away. As of right now, there is a disturbing trend in a specific measure that may soon point to serious concerns of solvency. At the same time, there is some growth in revenue... or is there?
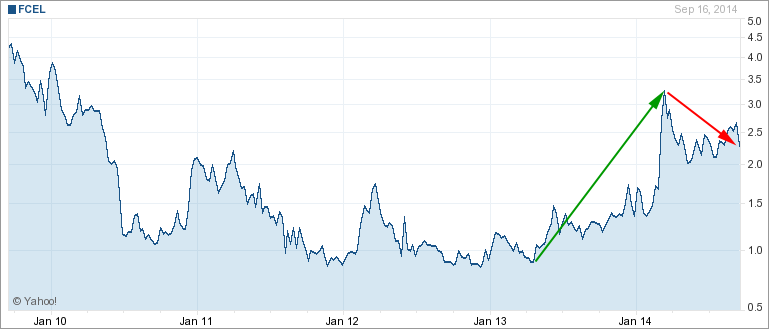
Let's start with the five-year stock chart.
Provided by Yahoo! Finance
Although many people may not know, this firm has actually been around for quite some time (over 15-years). The stock hit an annual high of $4.74, hit an annual low of $1.18, and is now in purgatory at $2.24... fading slowly.
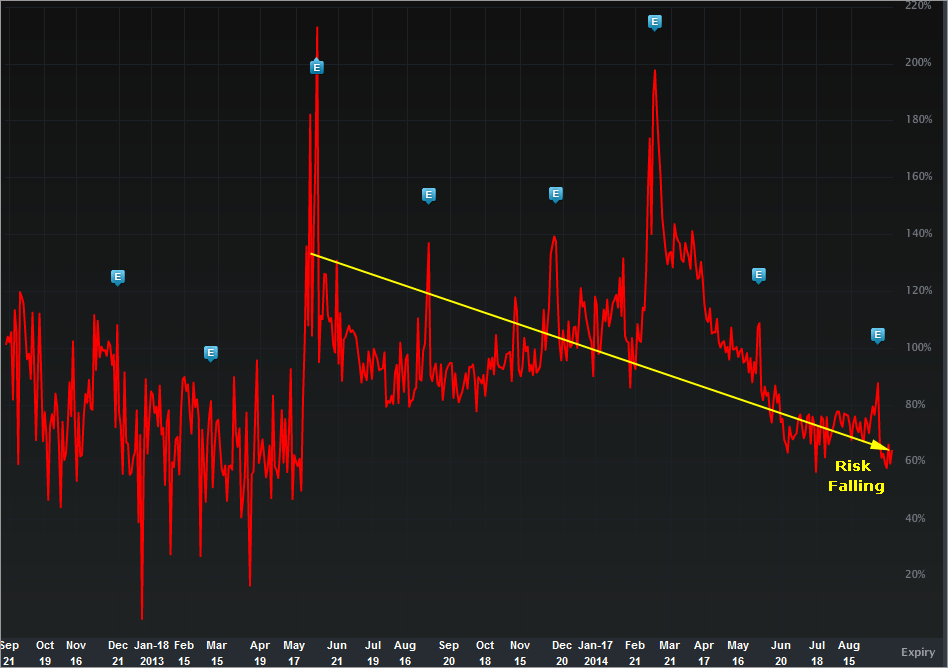
Let's turn to the risk as reflected by the option market before we dive into the fundamentals. The IV30™ chart in isolation, below.
Provided by Livevol
The implied volatility is the forward looking risk in the equity price as reflected by the option market (IV30™ looks forward exactly 30 calendar days).
In English, the red curve is the risk in future stock price movement. We can see a steady decrease in forward looking risk by the option market over the last year, which is interesting considering the stock has had such a large 52 week range.
Let's look at some visualizations.
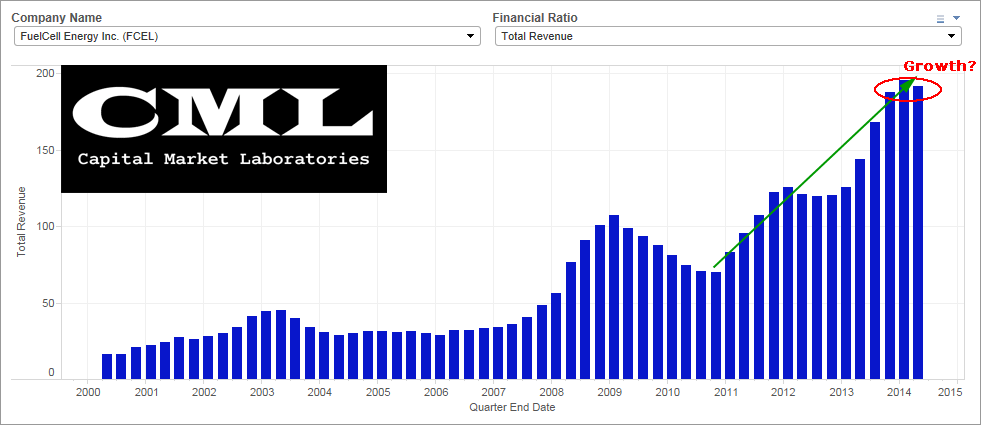
Revenue (TTM)
Although this firm is often lumped in with PLUG, it has seen substantially larger revenue gains and sits now at ~$180M in revenue for the trailing twelve months (PLUG is under $40M). This revenue chart is promising at first blush, but...
If we look at quarterly data (not TTM), these are the last four results (from most recent to least recent): $43M, $38M, $44M, $55M
Are revenues really growing at all as of right now?...
Gross Margin %
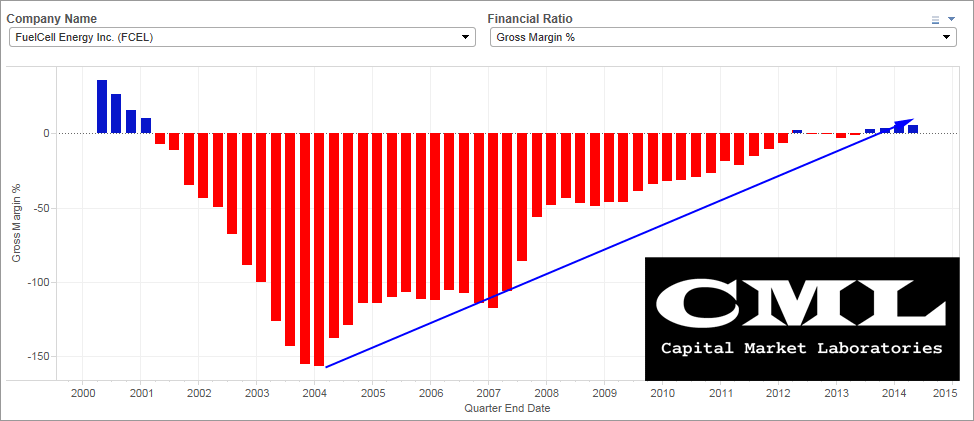
Gross margins for FCEL have been atrocious, even negative. There has been a rather remarkable recovery however, and now, though it's small, gross margins are actually positive. This is an absolute must for the firm if it will continue on as a going concern.
R&D Expense / Operating Expense
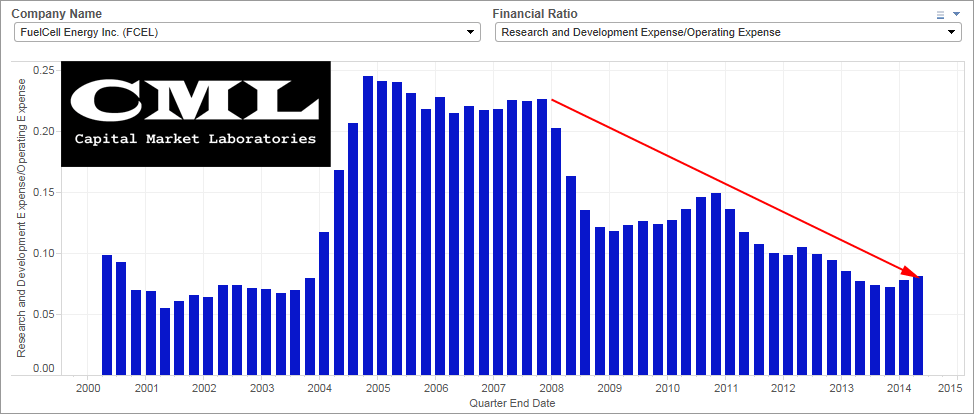
In 2004 FCEL was spending about $0.25 out of every $1 of operating expense on research & development. That number has now collapsed to ~$0.07 out of every $1. Controlling expenses is good, and keep in mind that this a ratio relative to operating expenses which are in and of themselves increasing, but... man that looks like a huge drop.
Net Income (TTM)
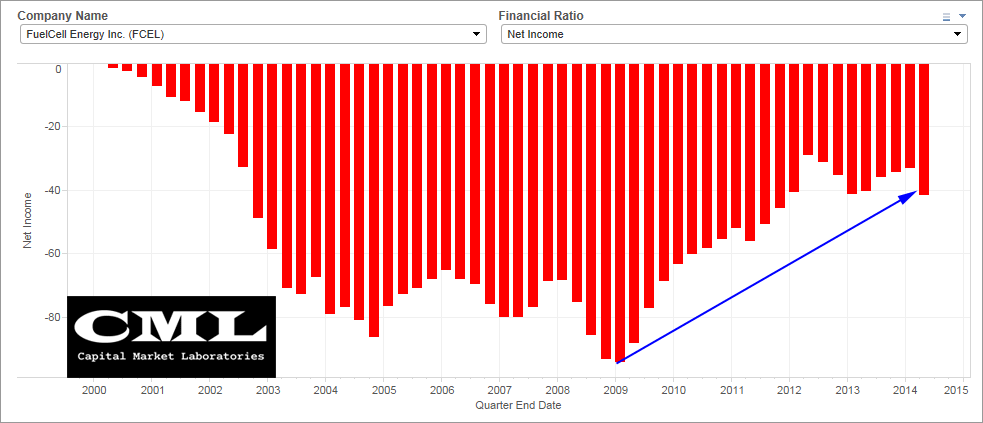
When it comes down to it, at some point this firm must turn a profit, something it has not done over a twelve-month period in 14-years. The losses are shrinking, so the trend is promising but... again, this is not a good chart at all.
Cash Ratio
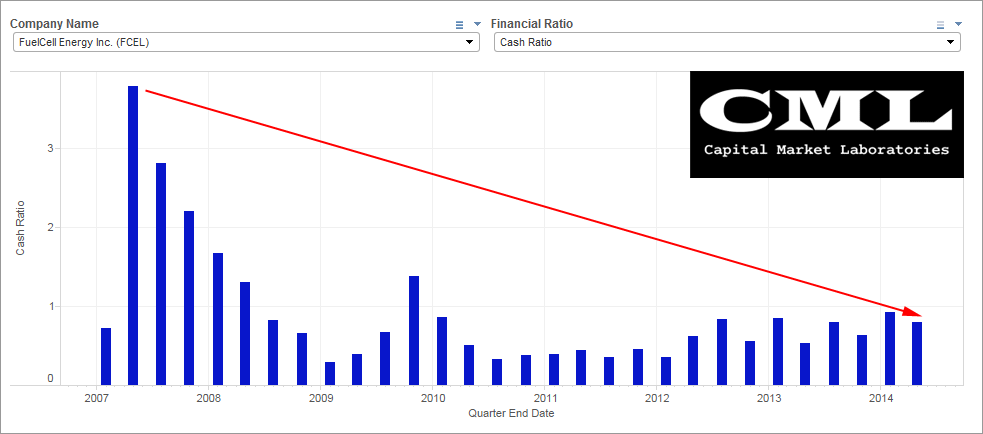
Considering that the firm hasn't turned a profit, a fair question is, "will it just go away?" Time will tell, it could also be a huge winner as technology and implementation of it grows. One of the most common (but conservative) measures of liquidity is something called the cash ratio: The ratio of a company's total cash and cash equivalents to its current liabilities. I do note that this ratio excludes inventory and accounts receivable which for FCEL amount to nearly $100MM... no small amount considering the firm's total cash (and equivalents) is just $112M.
In either case, conservative or not, a cash ratio trend like this is not only "bad," it's frightening.
One huge note here: The current ratio ("The current ratio can give a sense of the efficiency of a company's operating cycle or its ability to turn its product into cash." via http://www.investopedia.com/terms/c/currentratio.asp) for FCEL has been declining as well but is at 2.1 right now. That number must stay above 1 or the firm would not be able to pay off its obligations if they came due, but... FCEL has never been below 1.5.
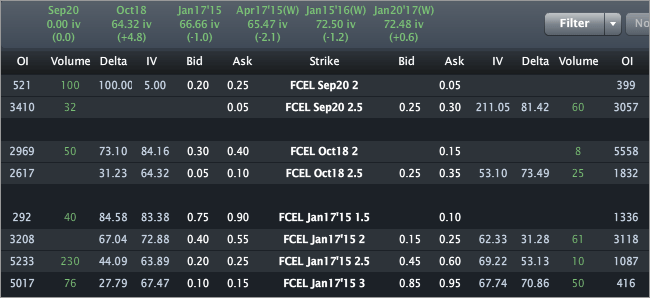
Finally, the Options Tab is included below.
Provided by Livevol
Using the at-the-money (ATM) straddle we can see that the option market reflects a price range of [$1.80, $3.20] by the end of trading on January 16th, 2015.
- If you believe the stock will be outside that range on expiry or any date before then, then you think the volatility is too low.
- If you believe that range is too wide, and that the stock will definitively be in that range on expiration, then you think volatility is too high.
- If you're not sure, and can make an argument for either case, then you think volatility is priced just about right.
This is trade analysis, not a recommendation.
Follow @OphirGottlieb
Tweet
Legal Stuff:
Options involve risk. Prior to buying or selling an option, an investor must receive a copy of Characteristics and Risks of Standardized Options. Investors need a broker to trade options, and must meet suitability requirements.
The information contained on this site is provided for general informational purposes, as a convenience to the readers. The materials are not a substitute for obtaining professional advice from a qualified person, firm or corporation. Consult the appropriate professional advisor for more complete and current information. I am not engaged in rendering any legal or professional services by placing these general informational materials on this website.
I specifically disclaim any liability, whether based in contract, tort, strict liability or otherwise, for any direct, indirect, incidental, consequential, or special damages arising out of or in any way connected with access to or use of the site, even if I have been advised of the possibility of such damages, including liability in connection with mistakes or omissions in, or delays in transmission of, information to or from the user, interruptions in telecommunications connections to the site or viruses.
I make no representations or warranties about the accuracy or completeness of the information contained on this website. Any links provided to other server sites are offered as a matter of convenience and in no way are meant to imply that I endorse, sponsor, promote or am affiliated with the owners of or participants in those sites, or endorse any information contained on those sites, unless expressly stated.


Thank you for the Analysis. I am a big fan of your posts and appreciate the time you put in.
ReplyDelete