| Tweet | Follow @OphirGottlieb |  |  |
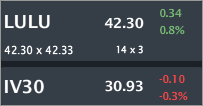
LULU is trading $42.30, up 0.8% with IV30™ down 0.3%. The Symbol Summary is included below.
Provided by Livevol
Conclusion
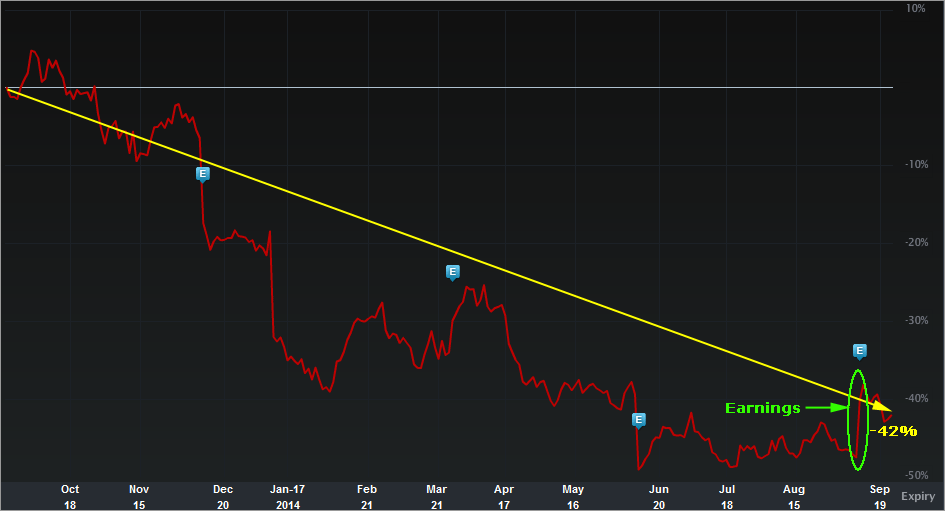
LULU stock is down over 40% in the last year, up abruptly off of a recent earnings beat and has some very interesting trends happening inside the business when looking at the financial measures.
All of this is in the backdrop of a risk pricing from the option market that is near multi-year lows. Is LULU at equilibrium, or is it ready to break (up or down)?
If you fall in the, "it's gonna move a lot" camp, the option market is staring you in the face and saying, "no it isn't." That's a potential opportunity.
Earnings News
-----------------
Shares of leading yoga-inspired athletic apparel and accessories retailer, Lululemon Athletica Inc. (LULU) surged 13.9% as the company’s second-quarter fiscal 2014 earnings of 33 cents per share cruised ahead of the Zacks Consensus Estimate of 29 cents as well as the company’s forecast of 28–30 cents per share.
Results benefited from the company’s ongoing strategic move towards product and brand enhancements and global expansion. However, earnings plunged 15.4% on a year-over-year basis.
Source: Zacks via Yahoo! Finance Lululemon Q2 Earnings & Revenues Beat, Shares Jump 13.9%
-----------------
OK, let's get to it... First, the one-year stock chart in "return" mode.
Provided by Livevol
We can see a frighteningly steady decline in the share price, and that pop just recently off of earnings. Now let's examine what's going on in the guts of the firm and see if the company truly is in equilibrium or if the risk pricing (coming later) is just... wrong...
Company Analysis
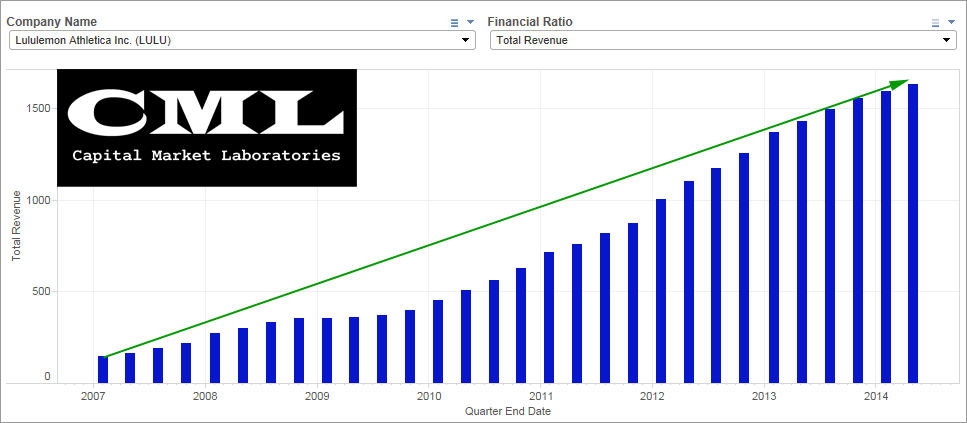
Total Revenue (TTM)
So, that's a pretty chart... Since LULU hasn't filed their 10-Q for the most recent quarter (that comes in about 45 days per SEC rules) we can't include those numbers, but it doesn't matter. Revenue in TTM have increased from $148M to $1.6B in less than eight years.
Net Income (TTM) aka Earnings
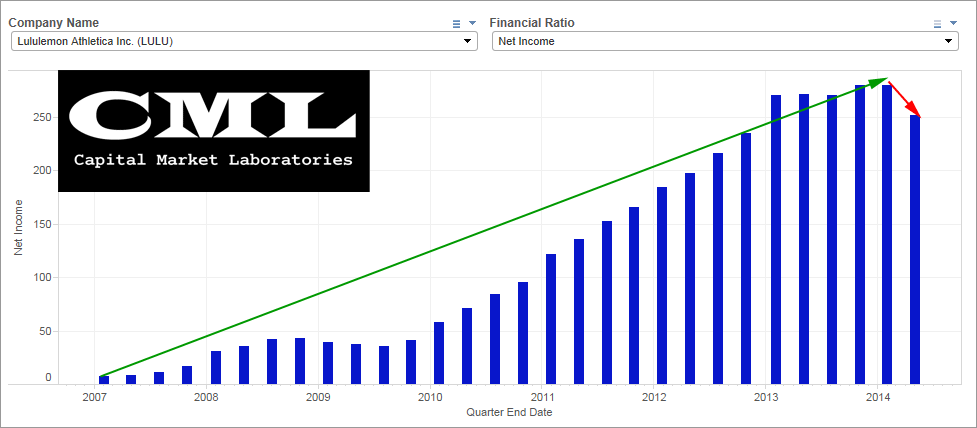
Earnings have boomed from $7.7M (trailing-twelve-months) to now over $251M. But... the trend is down and I re-quote the article from Zacks above: "earnings plunged 15.4% on a year-over-year basis." Keep asking, is this company in equilibrium?
Peer Analysis
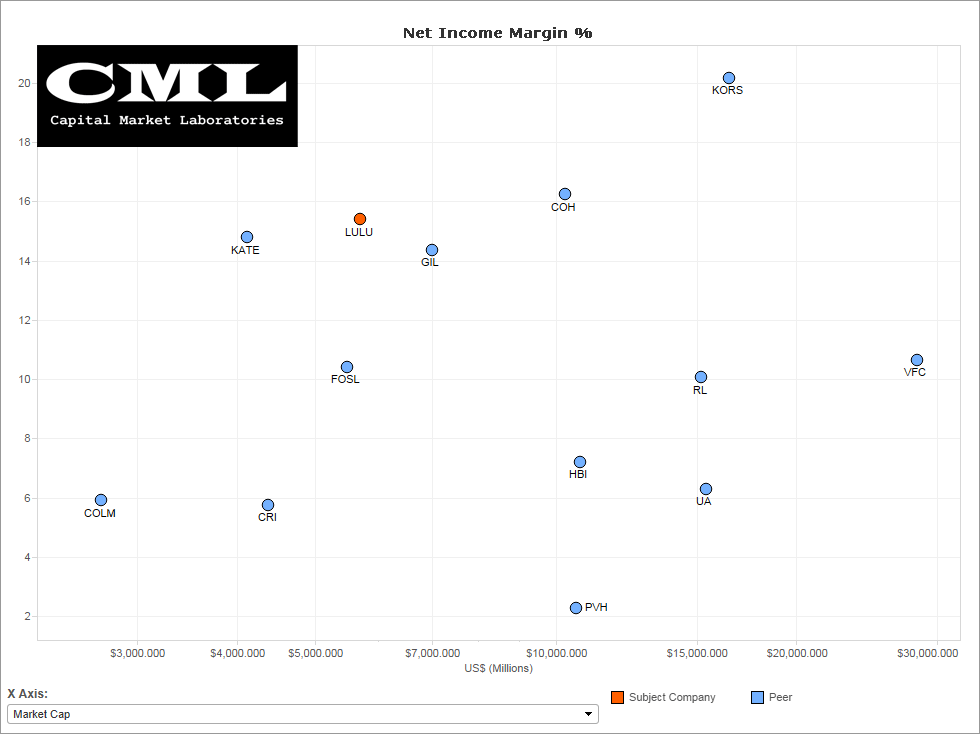
Net Income Margin %
A fair question is how LULU's earnings margin % looks relative to peers. It's actually not bad at all... certainly in the upper tier. But... it's slipping...
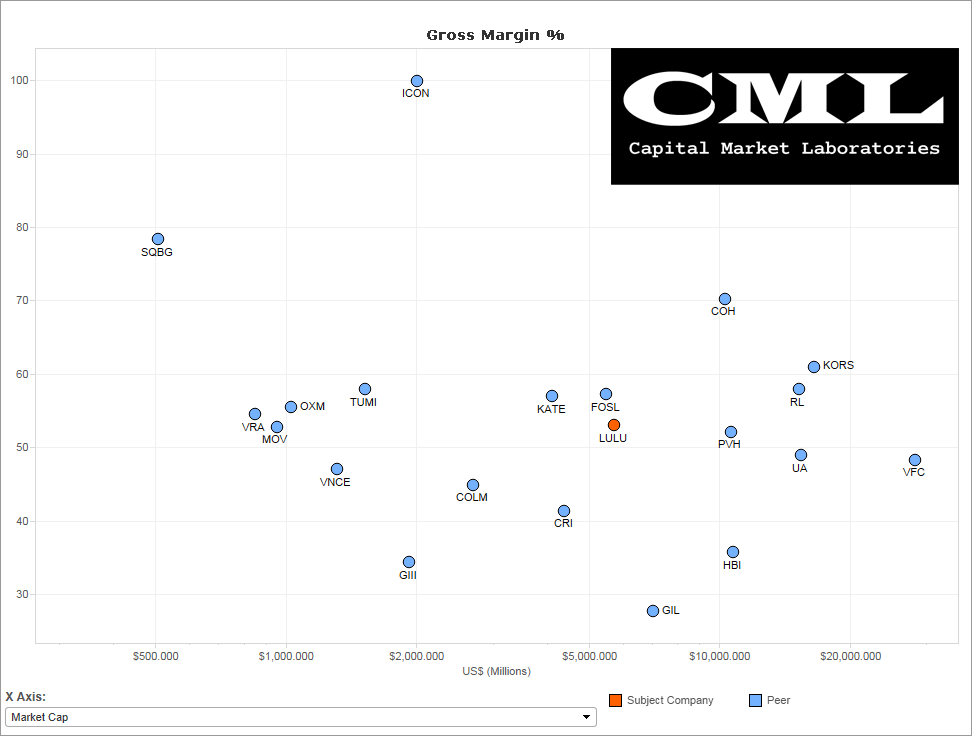
Gross Margin %
Gross margin % is one of the make or break measures for retail and LULU is pretty much middle of the road relative to peers. They are not a super premium brand, but they ain't cheap either.
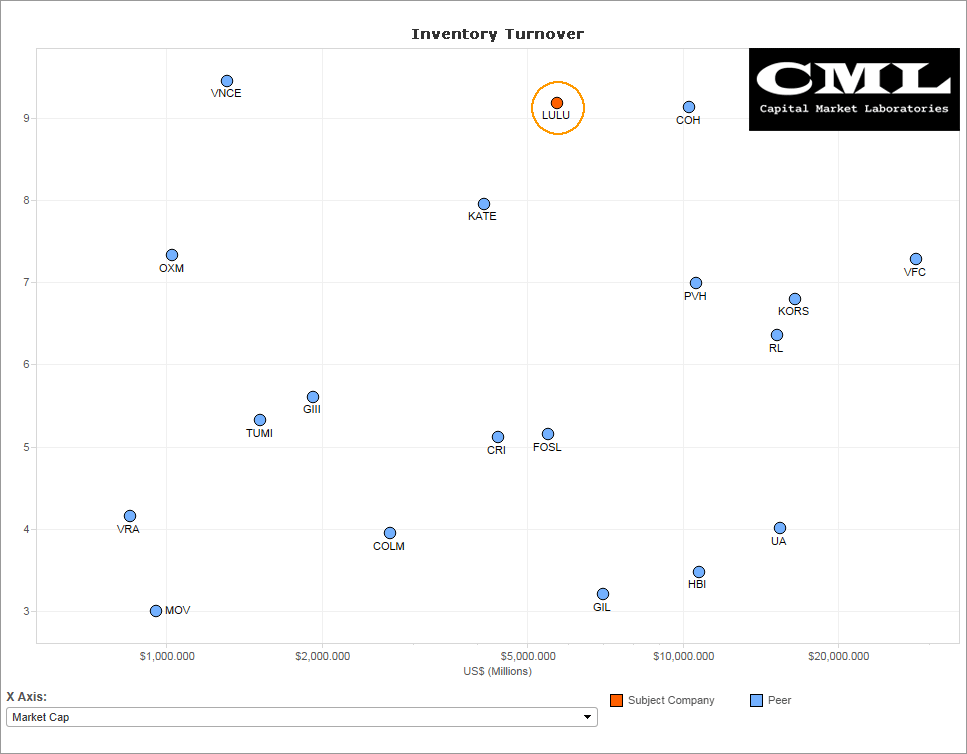
Inventory Turnover
This really is the end-all-be-all for retail. "In accounting, the Inventory turnover is a measure of the number of times inventory is sold or used in a time period such as a year. The equation for inventory turnover equals the Cost of goods sold divided by the average inventory. A low turnover rate may point to overstocking, obsolescence, or deficiencies in the product line or marketing effort. Conversely a high turnover rate may indicate inadequate inventory levels, which may lead to a loss in business as the inventory is too low. This often can result in stock shortages." (Source: Wikipedia).
High inventory turns for LULU are actually pretty good. I don't know the firm that well, so this is hardly an "auditor" type analysis, but the high turns relative to peers I would view as a positive unless I'm missing the ball here and the firm has had issues with lost business due to inventory shortfalls.
Risk Pricing Analysis
Let's turn to the IV30™ chart in isolation, below.
Provided by Livevol
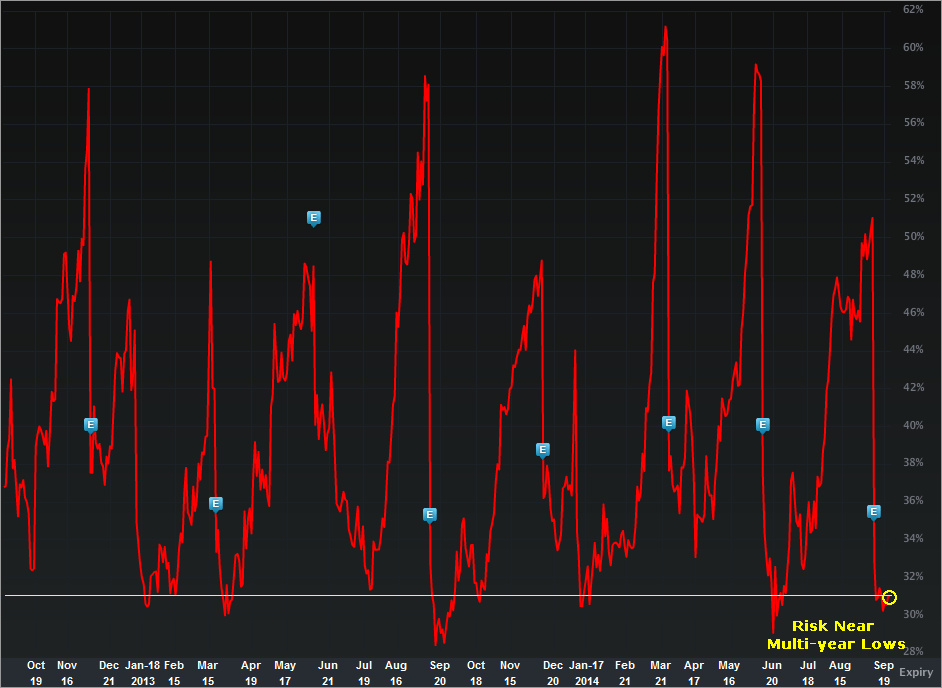
The implied volatility is the forward looking risk in the equity price as reflected by the option market (IV30™ looks forward exactly 30 calendar days).
In English, the red curve is the risk in future stock price movement. So the IV30 explode into earnings and collapsed after earnings which is totally normal and expected. What we want to focus on is not the spike and dip, but rather where the number lies right now. As we can see with that yellow line I've drawn in, the forward looking risk is pretty low relative to the last two-years. On an annual basis, the IV30 is in the 8th percentile.
This all points to "low risk pricing."
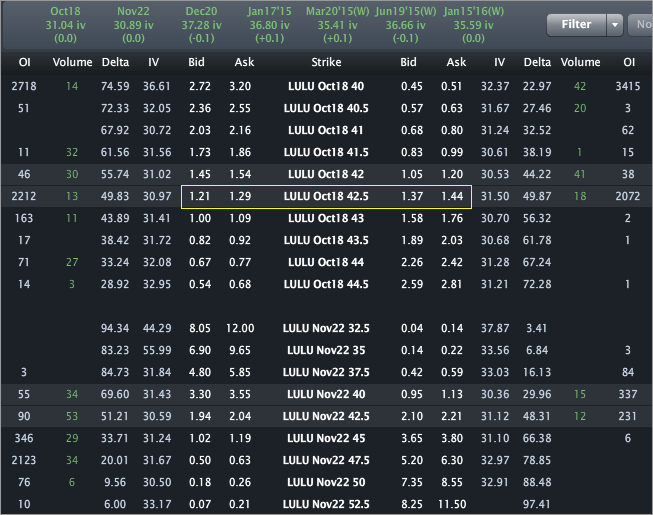
Finally, the Options Tab is included below.
Provided by Livevol
Using the at-the-money (ATM) straddle we can see that the option market reflects a price range of [$39.80, $45.20] by the end of trading on October 17th.
- If you believe the stock will be outside that range on expiry or any date before then, then you think the volatility is too low.
- If you believe that range is too wide, and that the stock will definitively be in that range on expiration, then you think volatility is too high.
- If you're not sure, and can make an argument for either case, then you think volatility is priced just about right.
This is trade analysis, not a recommendation.
Follow @OphirGottlieb
Tweet
Legal Stuff:
Options involve risk. Prior to buying or selling an option, an investor must receive a copy of Characteristics and Risks of Standardized Options. Investors need a broker to trade options, and must meet suitability requirements.
The information contained on this site is provided for general informational purposes, as a convenience to the readers. The materials are not a substitute for obtaining professional advice from a qualified person, firm or corporation. Consult the appropriate professional advisor for more complete and current information. I am not engaged in rendering any legal or professional services by placing these general informational materials on this website.
I specifically disclaim any liability, whether based in contract, tort, strict liability or otherwise, for any direct, indirect, incidental, consequential, or special damages arising out of or in any way connected with access to or use of the site, even if I have been advised of the possibility of such damages, including liability in connection with mistakes or omissions in, or delays in transmission of, information to or from the user, interruptions in telecommunications connections to the site or viruses.
I make no representations or warranties about the accuracy or completeness of the information contained on this website. Any links provided to other server sites are offered as a matter of convenience and in no way are meant to imply that I endorse, sponsor, promote or am affiliated with the owners of or participants in those sites, or endorse any information contained on those sites, unless expressly stated.


No comments:
Post a Comment