

| Tweet | Follow @OphirGottlieb |  |  |

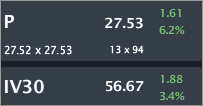
P is trading $27.53, up 6.2% with IV30™ up 3.4%. The Symbol Summary is included below.
Provided by Livevol
News
Pandora Media (P) shares are up 4.8% to $27.18 on Tuesday after analysts at JPMorgan reiterated their "overweight" and $42 price target in a research note today. The firm bases this view on the expectation that the Internet radio company will see stronger advertising revenue throughout the rest of this year as its listener hours are currently near all-time highs.
Source: TheStreet.com: Why Pandora (P) Stock Is Rising Today, written by Tony Owusu.
Conclusion
That last part of the note from JPM is not a throw away nor do I believe it is the real risk. While revenue is growing rapidly in P, so is competition and that competition (among other things) is holding one key financial measure back, and that financial measure keeps P at losses (rather than earnings). We'll look at five fundamental charts, then the option market risk pricing and see that this firm is in flux, while the option market points to lower risk.
The all-time stock chart is include below.
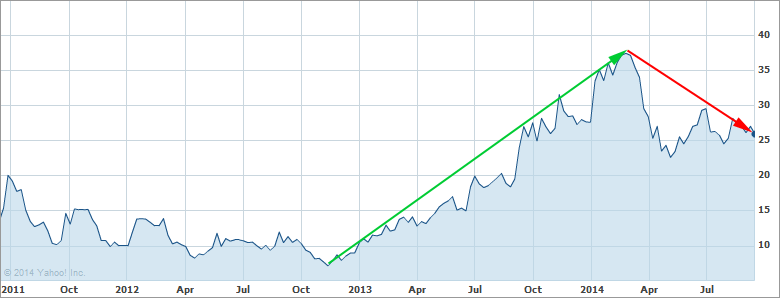
Provided by Yahoo! Finance
We can see the abrupt run up from ~$8 to ~$37 in just over a year, and then the recent slide back down to $27.50. For the last several months the stock has been in a bit of a quiet period, which is reflected in the risk pricing by the option market.
Let's turn to the IV60™ chart in isolation, below.
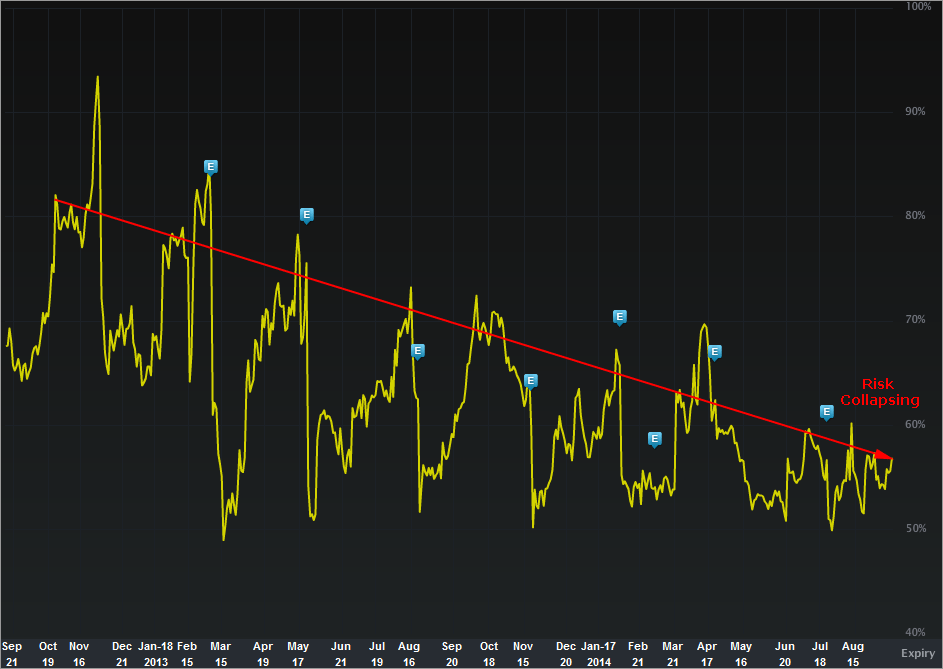
Provided by Livevol
The implied volatility is the forward looking risk in the equity price as reflected by the option market (IV60™ looks forward exactly 60 calendar days).
In English, the yellow curve is the risk in future stock price movement. We can see a rather systematic decline in the risk as reflected by the option market over the last two-years. Here's the question: Is risk really lower in P now than it has been in the prior two-years?
That's hard to answer, but some financial measures do point to an inflection point...
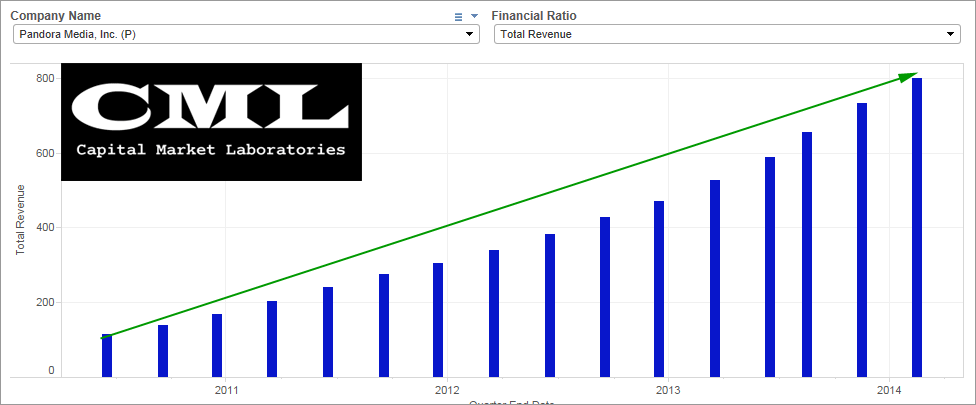
Revenue (TTM)
This in one of the best charts for Pandora. Revenue (TTM) has gone from ~$120M to ~$800M in four years.
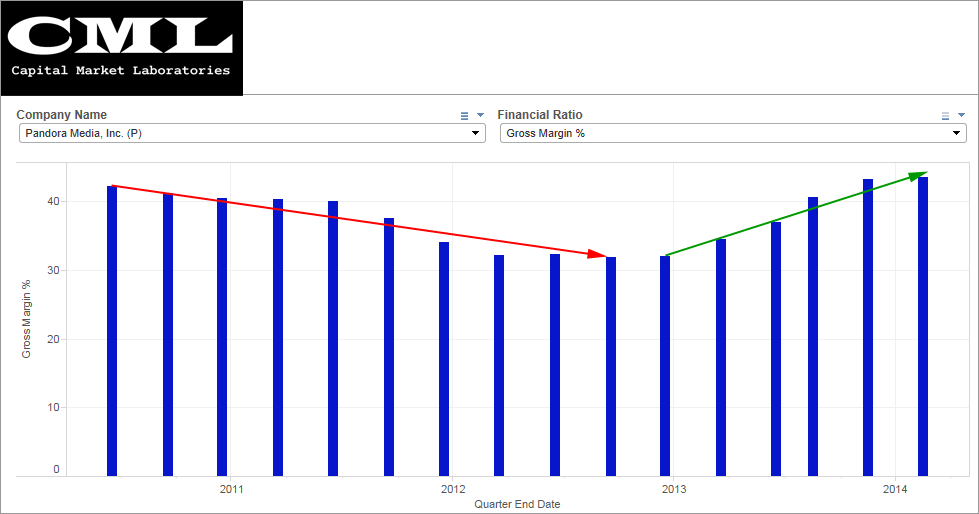
Gross Margin %
This is a pretty exciting chart for those that are long P. Gross Margin % has increased from ~32% to now ~44% as revenue have been increasing. This is really "the long thesis."
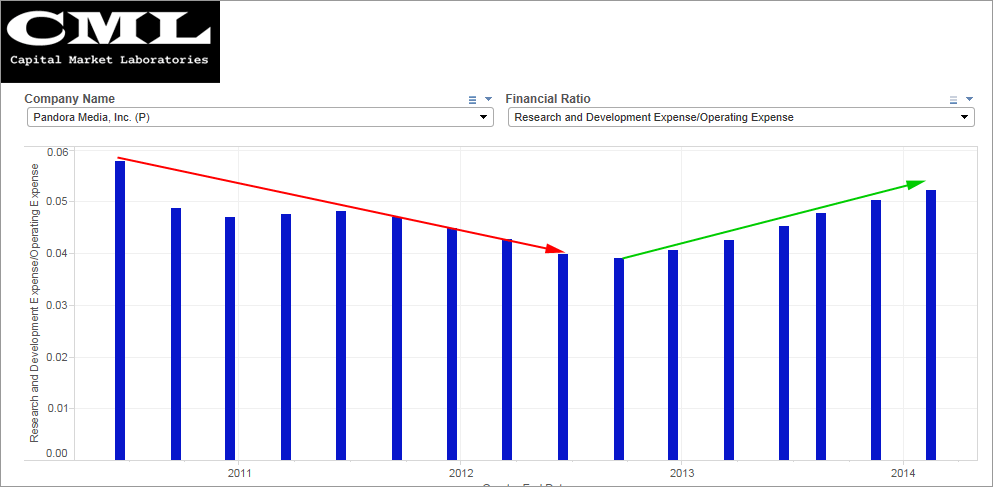
Research & Development over Operating Expense
While this chart looks to show a change in strategy, this is one where we have to look at scale (the y-axis). P is spending about $0.05 of every $1 in operating expense on R&D. That has grown from ~$0.04. So... in absolute terms, this isn't a huge change... but does support a thesis that P is still investing in making the product better.
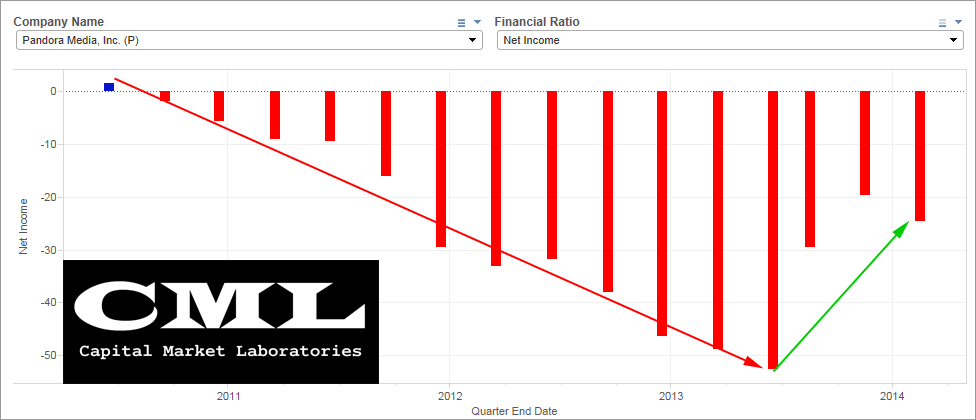
Net Income (aka Earnings)
The good news sort of runs out by the time we look to earnings (if you're a short) and continues to be good news (if you're along). perspective is everything here. P was losing money and accelerating losses for quite some time, but has turned that around rather significantly. That's the bullish case. The bearish case is pretty easy: The firm isn't making money.
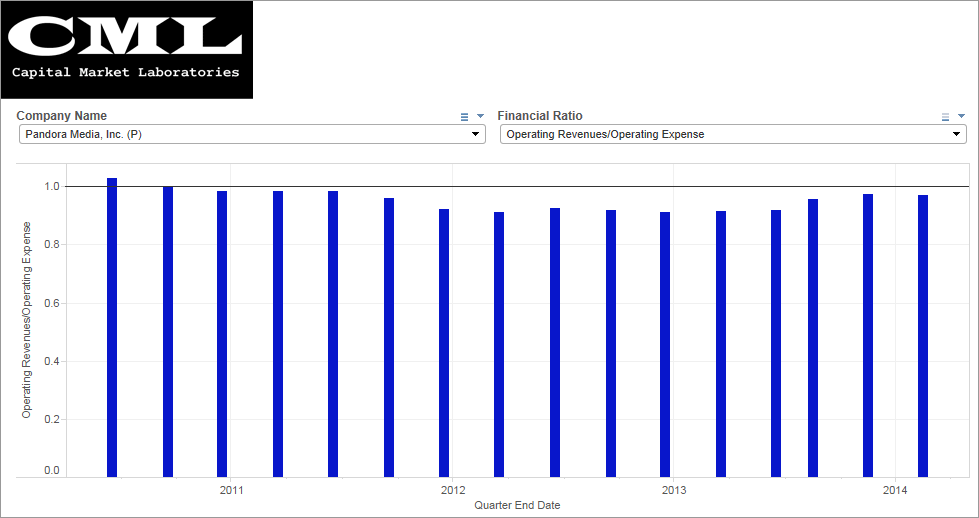
Operating Margins
This is one of my favorite measures, because it's so easy to understand. A firm must earn more than $1 in operating revenue for every dollar in operating expense in order to be profitable. This is really the end-all-be-all for Pandora. With increasing revenues and gross margins, longs have to be waiting for positive earnings... but, that will never happen if this measure doesn't break above 1.0 (aka operating revenue > operating expense). As of right now, the shorts can claim rather loudly that this measure looks asymptotic to 1, or... P just can't create a profit. The bulls would argue, the firm is inches away from a profit. Both arguments are valid.
Given all that stuff up there, I'm neither a bull nor bear on the stock price, but I am certainly not convinced the firm is in equilibrium. it simply cannot exist like this -- it must push to a profit and succeed, or it will go away (or be taken over).
Let's look at the option risk pricing explicitly via the option prices. The Options Tab is included below.
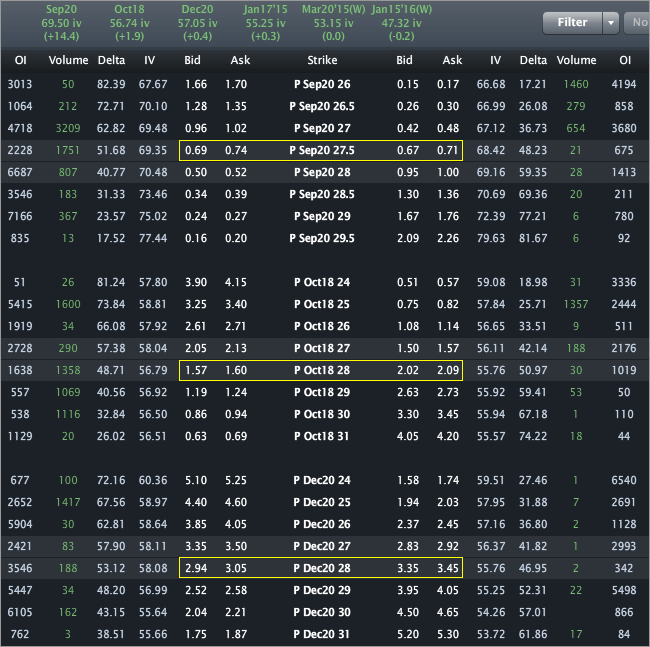
Provided by Livevol
Using the at-the-money (ATM) straddle we can see that the option market reflects a price range of [$24.50, $31.50] by the end of trading on Oct. 17th.
The range reflected y the option market is [$21.60, $34.40] by the end of trading on Dec. 19th.
- If you believe the stock will be outside that range on expiry or any date before then, then you think the volatility is too low.
- If you believe that range is too wide, and that the stock will definitively be in that range on expiration, then you think volatility is too high.
- If you're not sure, and can make an argument for either case, then you think volatility is priced just about right.
This is trade analysis, not a recommendation.
Follow @OphirGottlieb
Tweet
Legal Stuff:
Options involve risk. Prior to buying or selling an option, an investor must receive a copy of Characteristics and Risks of Standardized Options. Investors need a broker to trade options, and must meet suitability requirements.
The information contained on this site is provided for general informational purposes, as a convenience to the readers. The materials are not a substitute for obtaining professional advice from a qualified person, firm or corporation. Consult the appropriate professional advisor for more complete and current information. I am not engaged in rendering any legal or professional services by placing these general informational materials on this website.
I specifically disclaim any liability, whether based in contract, tort, strict liability or otherwise, for any direct, indirect, incidental, consequential, or special damages arising out of or in any way connected with access to or use of the site, even if I have been advised of the possibility of such damages, including liability in connection with mistakes or omissions in, or delays in transmission of, information to or from the user, interruptions in telecommunications connections to the site or viruses.
I make no representations or warranties about the accuracy or completeness of the information contained on this website. Any links provided to other server sites are offered as a matter of convenience and in no way are meant to imply that I endorse, sponsor, promote or am affiliated with the owners of or participants in those sites, or endorse any information contained on those sites, unless expressly stated.
No comments:
Post a Comment