| Tweet | Follow @OphirGottlieb |  |  |


This visualization is provided by: Capital Market Laboratories... Join Us
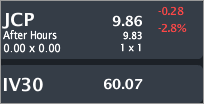
JCP closed Friday trading at $9.86, down 2.8% with IV30™ at 60.7%. The Symbol Summary is included below.
Provided by Livevol
Conclusion
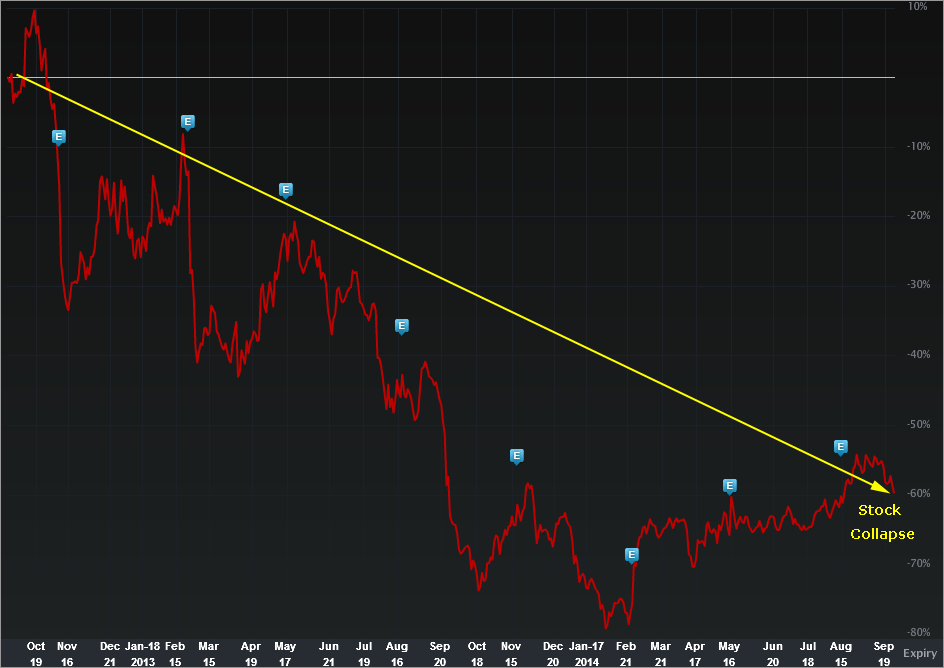
An investment in JCP is not one on the company it is but on a hope of the company it can become. The stock is down 60% in two-years and the fundamental measures don't have good, but they certainly have bad and downright, unbridled, ugly.
If the firm recovers, what a mighty victory for the firm (and longs). The road to relevance will be a difficult one. It's time to start "reading" and start "seeing."
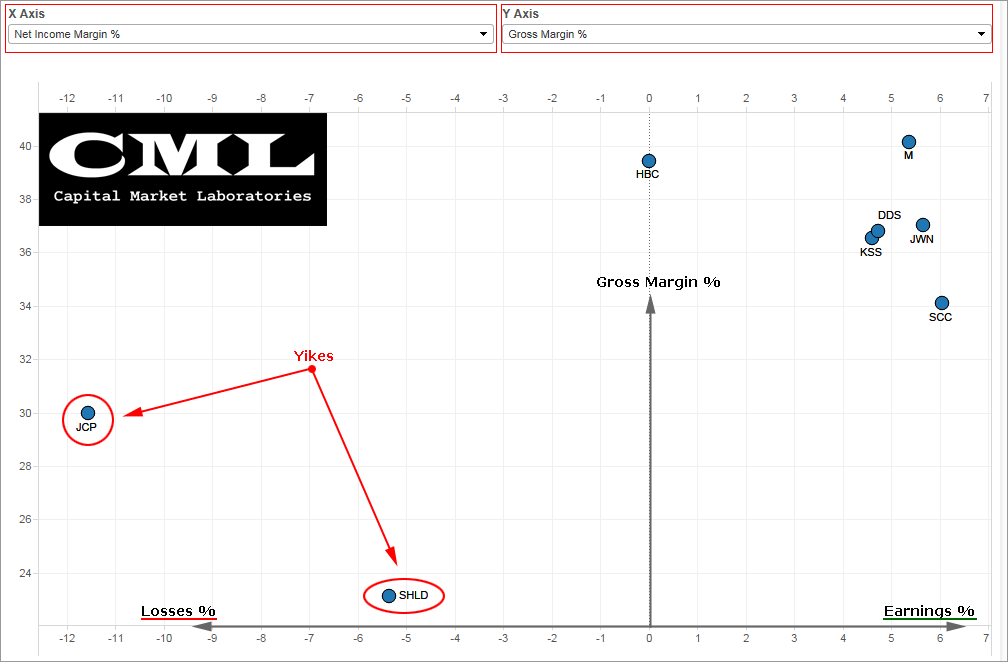
Before we get too far into the analysis, here's one chart with net income % on the x-axis and gross margin % on the y-axis. We can see there's JCP and SHLD... and everybody else.
Here's the two-year stock return chart.
Provided by Livevol
So basically... terrible...
Fundamental Measures
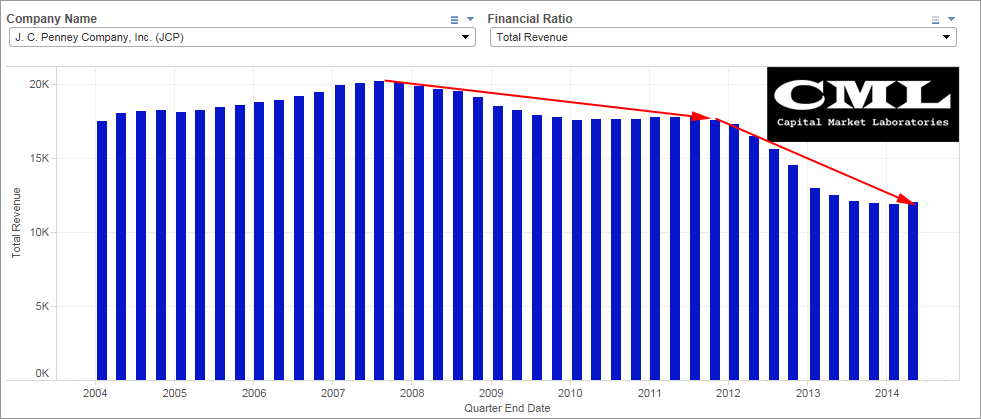
Total Revenue (TTM)
JCP revenue (ttm) has fallen from a high of over $20B to now ~$12B.
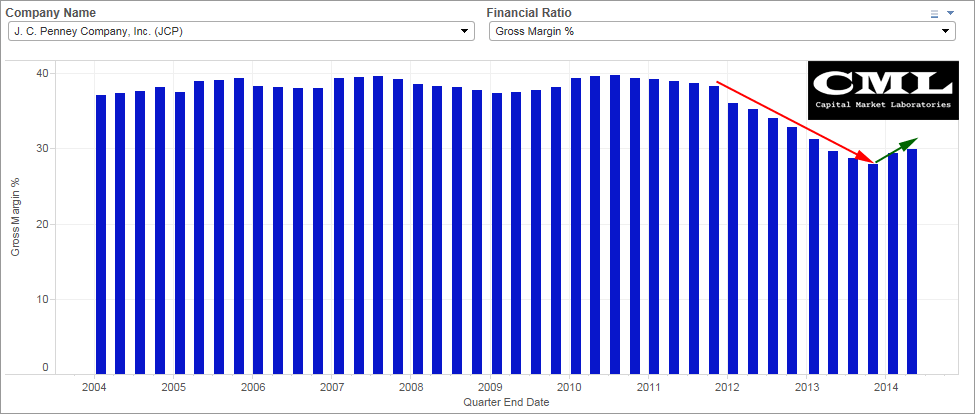
Gross Margin %
Gross margins have fallen from 40% to 30%, though they have recovered from a low of 27.94%
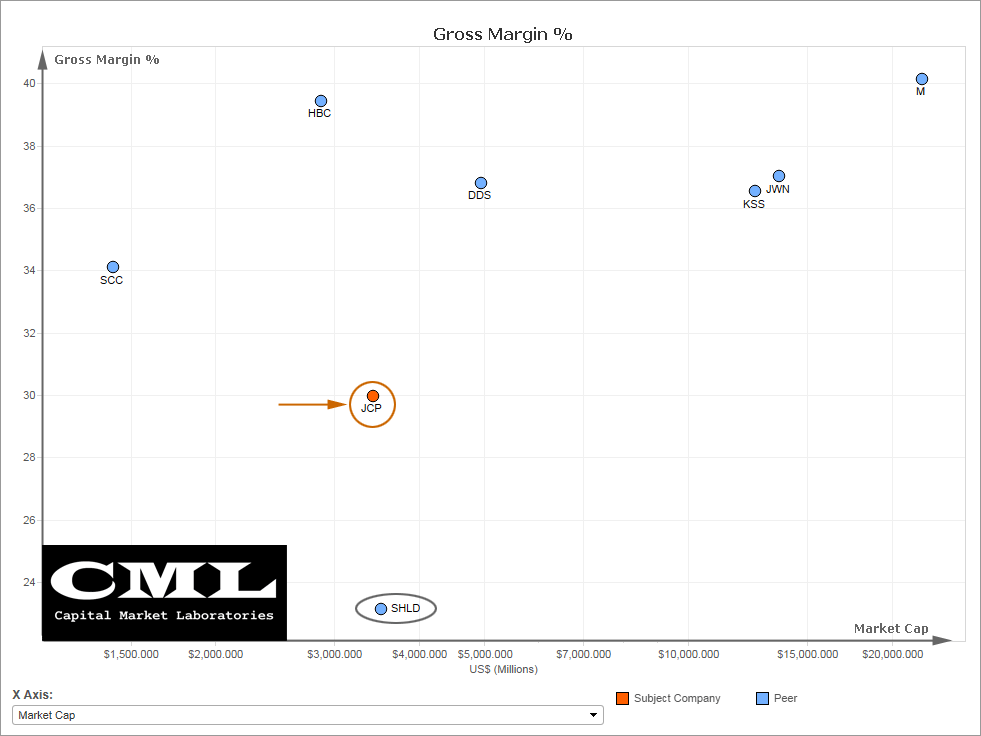
Gross Margin % (Comp to Peers)
I suppose the silver lining here is... There is one firm with worse gross margins, and that would be SHLD... and no one else.
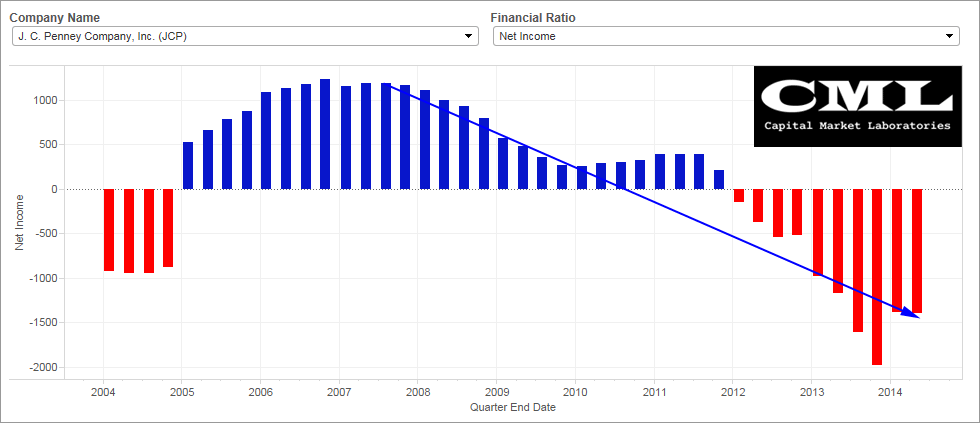
Net Income (TTM)
We saw some bad, but this is the beginning of ugly... JCP net income (ttm) has dropped from #1.2B to now a loss of $1.4B (negative $1.4B). Losses did reach an all-time low of $2B in a trailing twelve month period a couple of quarters ago.
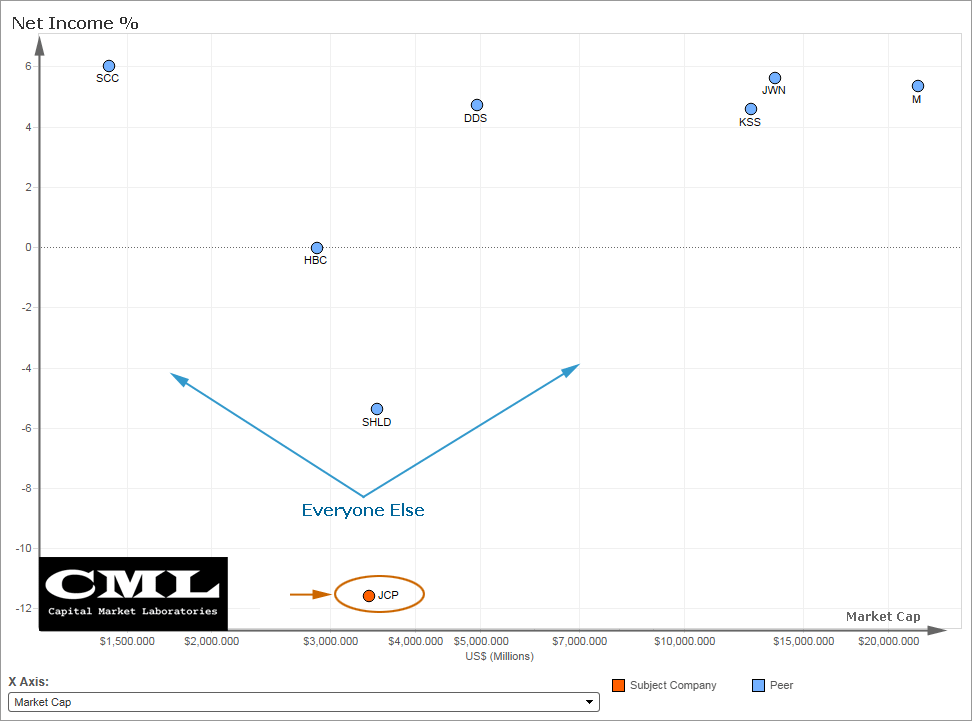
Net Income Margin % (Comp to Peers)
The above chart was ugly... this is hideous. JCP net income margin % is worse than any other retail North American retail department store. There's JCP... and everyone else.
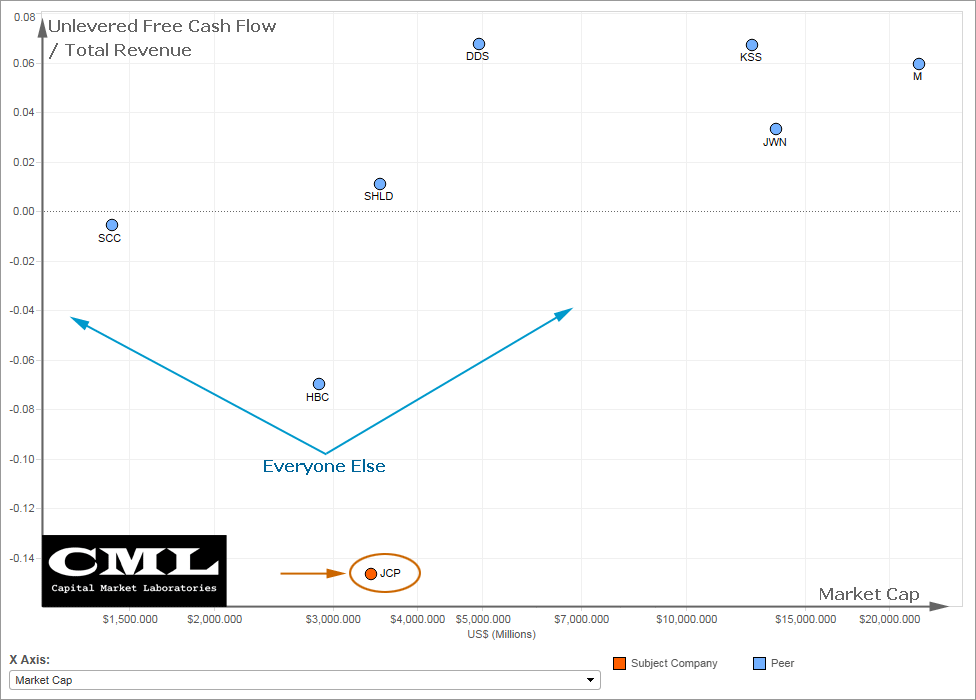
Unlevered Free Cash Flow / Total Revenue
As earnings go, so go free cash flow... Just like the prior scatter, JCP shows the absolute worst free cash flow/ total revenue of any retail department store in North America.
Want to do this analysis yourself... go here and try it. Capital Market Laboratories
This is trade analysis, not a recommendation.
Follow @OphirGottlieb
Tweet
Legal Stuff:
Options involve risk. Prior to buying or selling an option, an investor must receive a copy of Characteristics and Risks of Standardized Options. Investors need a broker to trade options, and must meet suitability requirements.
The information contained on this site is provided for general informational purposes, as a convenience to the readers. The materials are not a substitute for obtaining professional advice from a qualified person, firm or corporation. Consult the appropriate professional advisor for more complete and current information. I am not engaged in rendering any legal or professional services by placing these general informational materials on this website.
I specifically disclaim any liability, whether based in contract, tort, strict liability or otherwise, for any direct, indirect, incidental, consequential, or special damages arising out of or in any way connected with access to or use of the site, even if I have been advised of the possibility of such damages, including liability in connection with mistakes or omissions in, or delays in transmission of, information to or from the user, interruptions in telecommunications connections to the site or viruses.
I make no representations or warranties about the accuracy or completeness of the information contained on this website. Any links provided to other server sites are offered as a matter of convenience and in no way are meant to imply that I endorse, sponsor, promote or am affiliated with the owners of or participants in those sites, or endorse any information contained on those sites, unless expressly stated.


No comments:
Post a Comment