| Tweet | Follow @OphirGottlieb |  |  |

GS is trading $187.91, up 1.9% small with IV30™ down 8.8%. The Symbol Summary is included below.
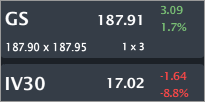
Provided by Livevol
Conclusion
This is a stock price, volatility and fundamental measures note on GS. While the stock is hitting 5-year highs, when we take a deeper dive into the business, there are some troubling comparisons that point to, if not less than fabulous positioning, at least some elevated risk. However, the option market is reflecting a risk collapse, indicating stable prices ahead.
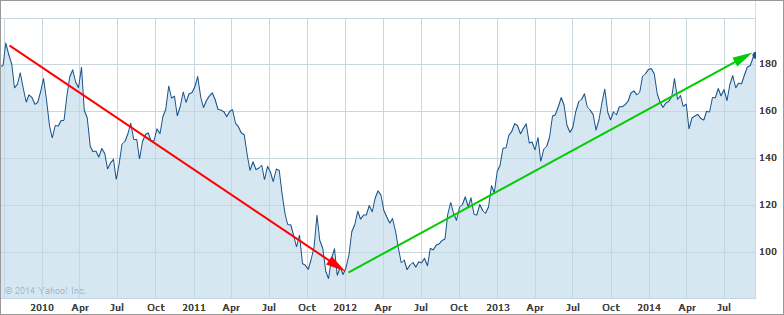
Let's start with the 5-year stock chart, below.
Provided by Yahoo! Finance
GS followed the entire finance industry in terms of stock price.. there was a remarkable correlation between the peer group... what we see today is ~5-year highs in stock price... and multi-year lows in risk.
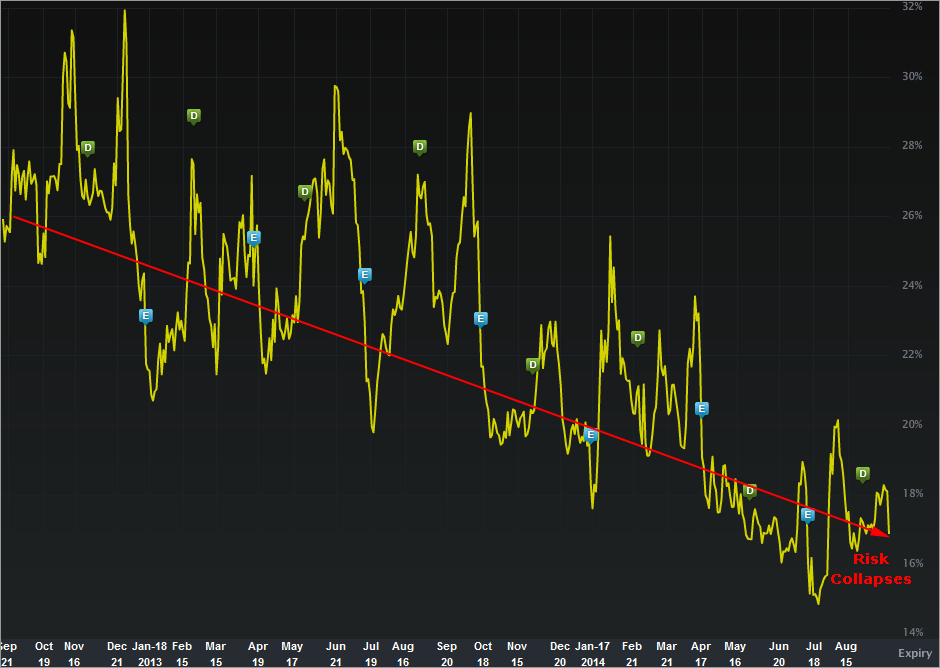
Let's turn to the IV60™ chart in isolation, below.
Provided by Livevol
The implied volatility is the forward looking risk in the equity price as reflected by the option market (IV60™ looks forward exactly 60 calendar days).
In English, the yellow curve is the risk in future stock price movement. Simply stated, the risk has been trending down rather linearly per the option market as the price has been climbing higher.
Let's turn to some fundamental measures and somethings you... may not have known... I certainly. didn't.
Total Revenue (TTM)
I look at this revenue time series and think, "so?..." In any case, it's hardly been a huge growth spurt for GS. The question becomes, "is GS growth in revenue comparable to peers?"

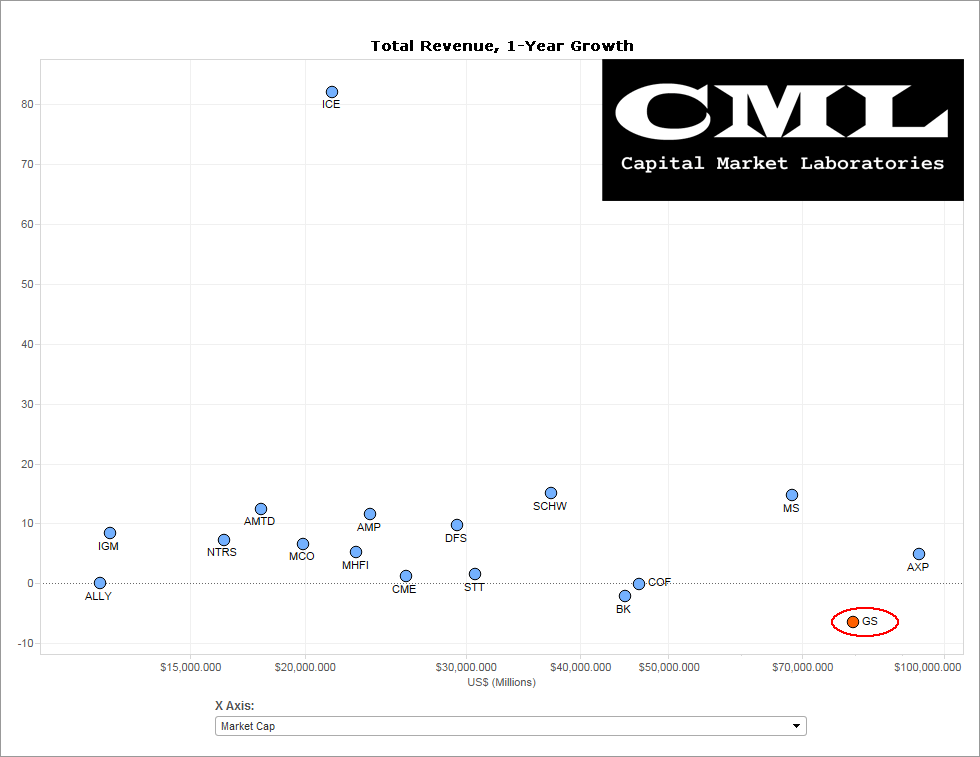
Total Revenue (TTM) - Comps
It turns out the answer to the question posed above is... no. It's difficult to find a peer group for GS that's more than maybe three companies, so you can certainly "mentally" exclude some of these companies (I left them on the chart for completeness). But, however you define the peer group, it's just this simple: GS total revenue revenue growth over the last year is lower than every single peer.
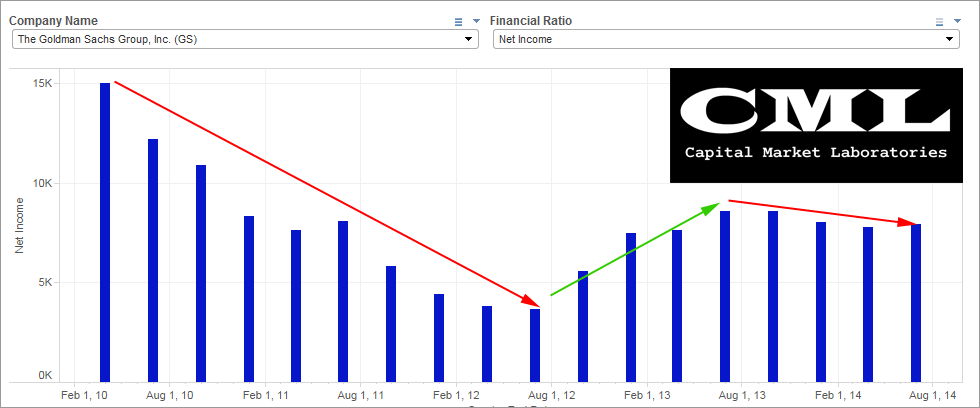
Net Income (TTM)
Let's turn from revenue and look to earnings. The time series looks strikingly similar to revenue. So, our next question must also be: "is GS earnings growth comparable to peers?"
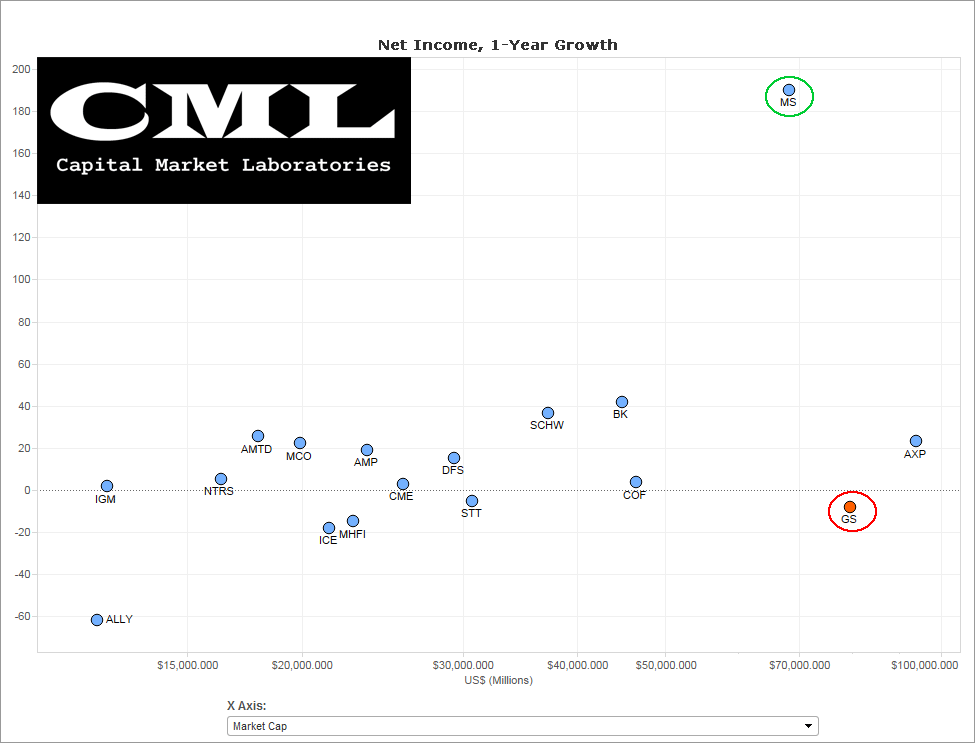
Net Income (TTM) - Comps
We have the same caveats for the peer group as before... Perhaps the most relevant peer is simply MS, but in any case, here we see again that GS basically looks... terrible...
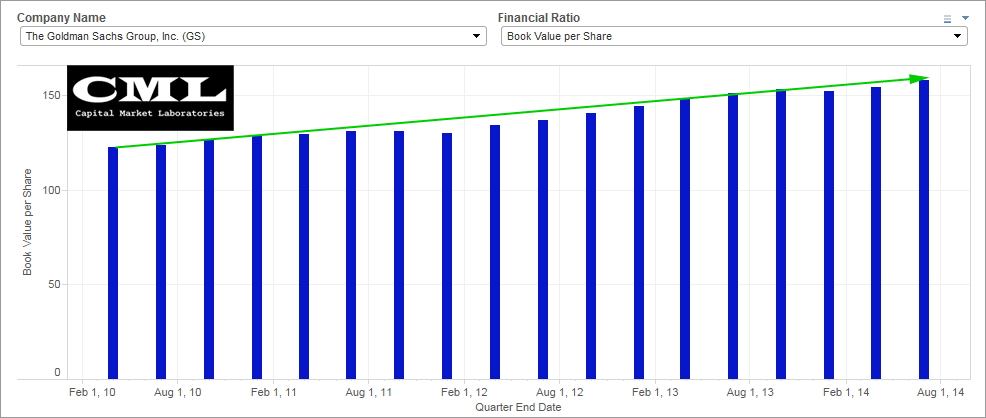
Book Value
Through all of this GS does continue to raise its book value...
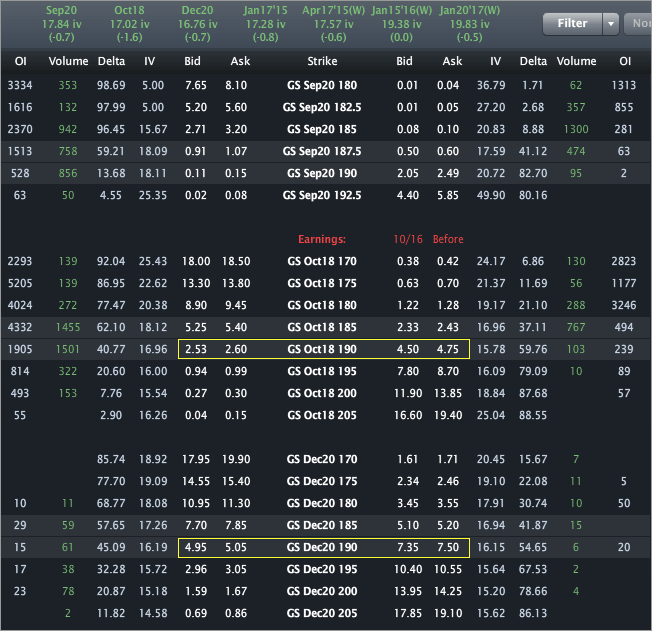
Finally, the Options Tab is included below.
Provided by Livevol
Using the at-the-money (ATM) straddle we can see that the option market reflects a price range of [$183, $197] by the end of trading on Oct. 17th
The range is [$177.50, $202.50] by the end of trading on Dec. 19th.
- If you believe the stock will be outside that range on expiry or any date before then, then you think the volatility is too low.
- If you believe that range is too wide, and that the stock will definitively be in that range on expiration, then you think volatility is too high.
- If you're not sure, and can make an argument for either case, then you think volatility is priced just about right.
This is trade analysis, not a recommendation.
Follow @OphirGottlieb
Tweet
Legal Stuff:
Options involve risk. Prior to buying or selling an option, an investor must receive a copy of Characteristics and Risks of Standardized Options. Investors need a broker to trade options, and must meet suitability requirements.
The information contained on this site is provided for general informational purposes, as a convenience to the readers. The materials are not a substitute for obtaining professional advice from a qualified person, firm or corporation. Consult the appropriate professional advisor for more complete and current information. I am not engaged in rendering any legal or professional services by placing these general informational materials on this website.
I specifically disclaim any liability, whether based in contract, tort, strict liability or otherwise, for any direct, indirect, incidental, consequential, or special damages arising out of or in any way connected with access to or use of the site, even if I have been advised of the possibility of such damages, including liability in connection with mistakes or omissions in, or delays in transmission of, information to or from the user, interruptions in telecommunications connections to the site or viruses.
I make no representations or warranties about the accuracy or completeness of the information contained on this website. Any links provided to other server sites are offered as a matter of convenience and in no way are meant to imply that I endorse, sponsor, promote or am affiliated with the owners of or participants in those sites, or endorse any information contained on those sites, unless expressly stated.


No comments:
Post a Comment