| Tweet | Follow @OphirGottlieb |  |  |

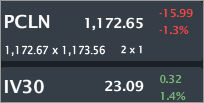
PCLN is trading $1,172.65, down 1.3% with IV30™ up 1.4%. The Symbol Summary is included below.
Provided by Livevol
Priceline Group Inc, formerly Priceline Com Incorporated, is an online travel company that offers its customers hotel room reservations at over 295,000 hotels worldwide through the Booking.com, priceline.com and Agoda brands.
Conclusion
There may be one chart, as simple as it gets, that shows us what drives PCLN stock price.
This is a stock, volatility and fundamentals note on PCLN. In four fundamental charts we can see how this firm has risen to a $61B market capitalization, an absolute giant of technology, a cash creation machine and... a firm that sits squarely in equilibrium... or so reads the option market.
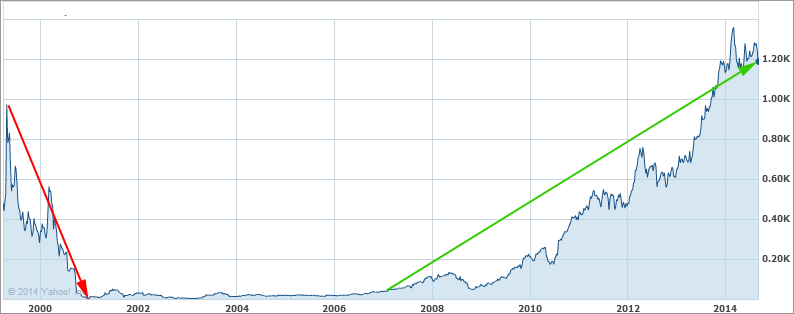
Let's start with the stock chart (all-time).
Provided by Yahoo! Finance
I love that PCLN existed back in the 2000 tech bubble, so we can see how far it rose, how far it fell and... how much higher it has risen.
Let's turn to the financials, then the option market.
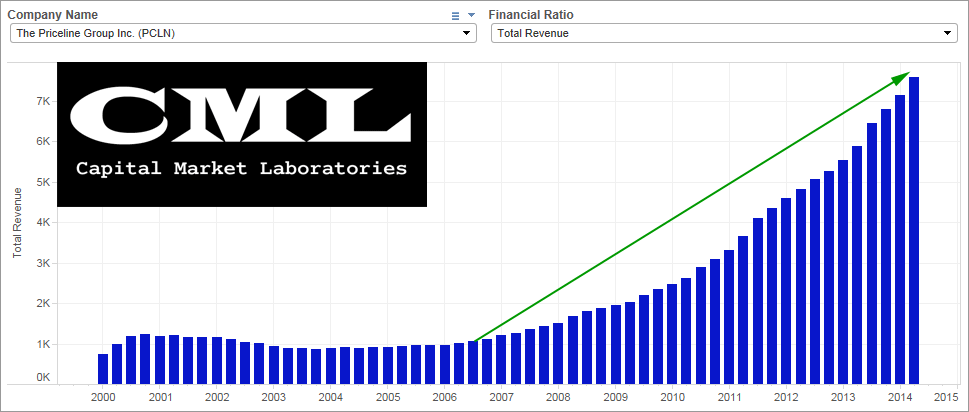
Revenue (TTM)
Well... this is sort of a dream chart. In the most recent trailing twelve-months PCLN has generated over $7.5B and that number continues to grow.
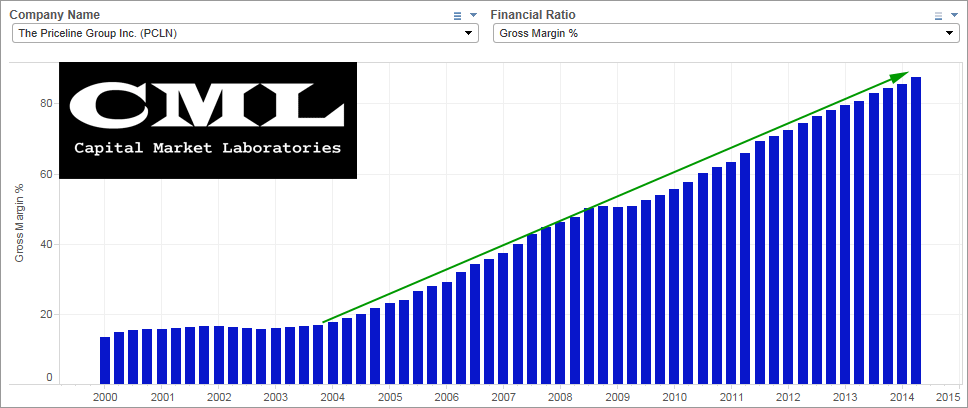
Gross Margin %
Of all the chats we will look at, this is the most breathtaking for me. PCLN has grown revenue to massive levels, and during that time gross margin % has risen from ~15% to now 87%. That is insane.
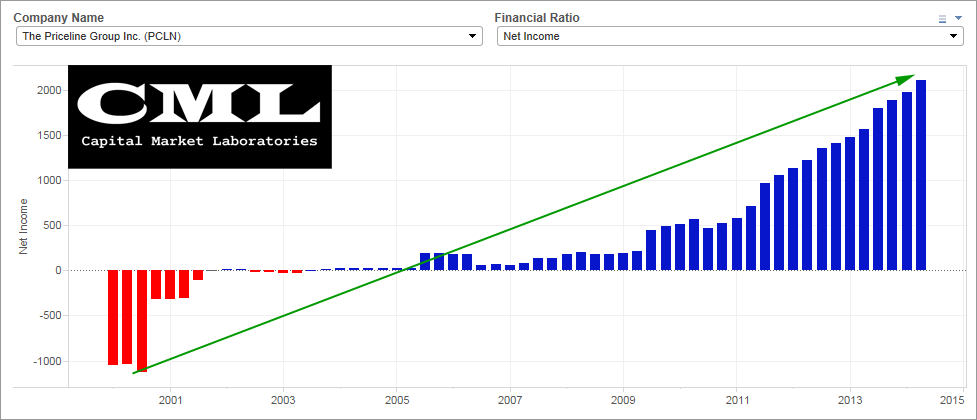
Net Income (TTM)
With revenue exploding and gross margin % hitting impossibly high levels, earnings are nearly tautological. In the case of PCLN, the realized earnings have gone from a loss of $1B to a profit of $2.1B. While earnings are growing, the firm is trading at an elevated 31 P/E ratio and an 18 forward P/E.
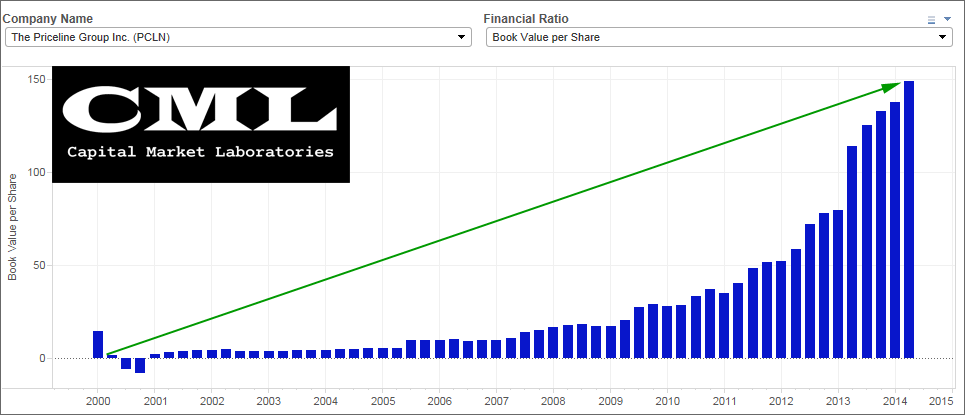
Book Value
Obviously as earnings have grown, so has book value. As of right now, PCLN shows a book value of $149.20 or a stock price which is ~ 8x book value.
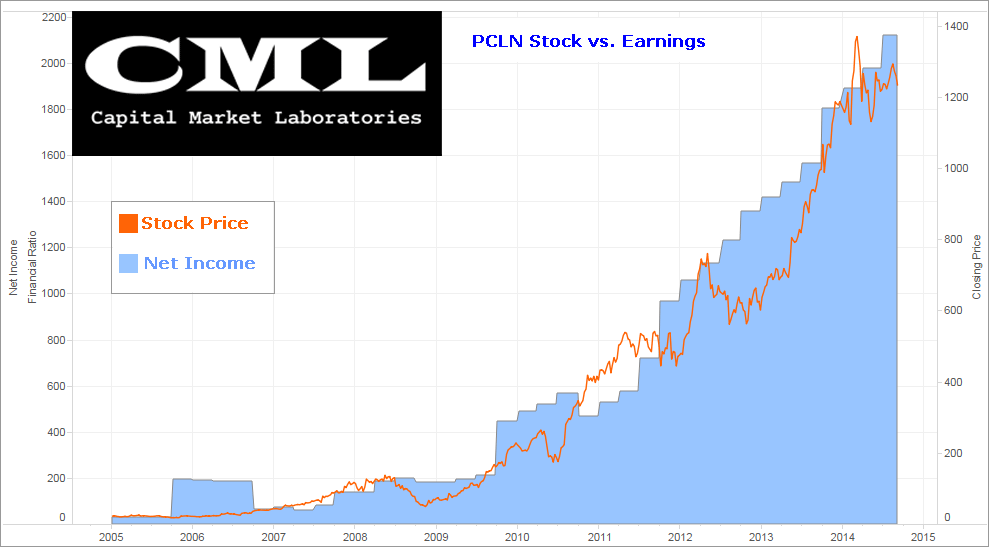
Stock Price vs. Net Income
So we looked at a bunch of data and a reasonable question is... does this matter? Well, it turns out if we chart the stock price for PCLN vs. the firm's net income (aka earnings), it turns out they mirror each pother quite well. One could even make an argument that PCLN has room to move up. I do caution, a pattern or correlation does not imply causality.
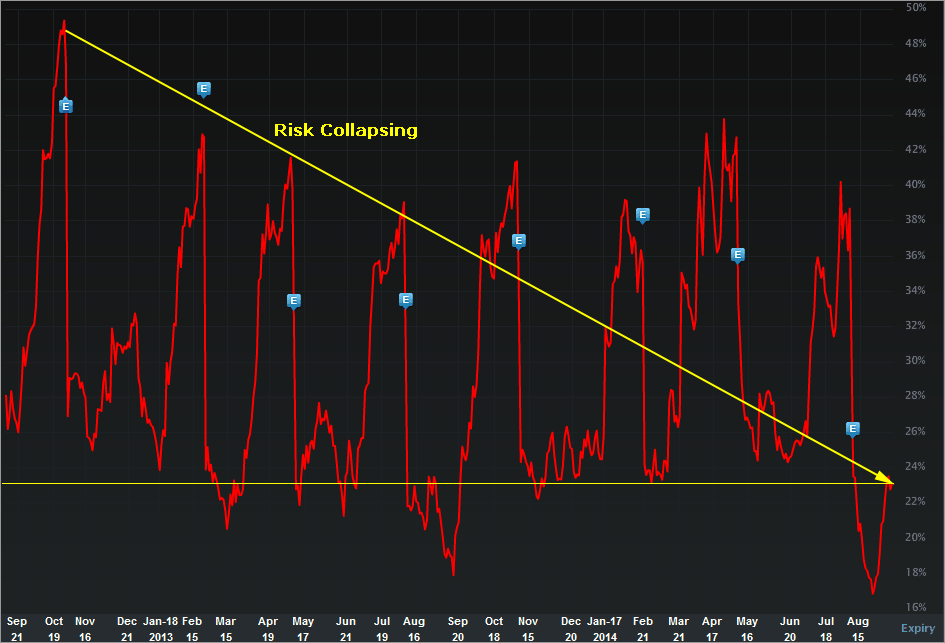
Now let;'s look at the option market and risk pricing. The IV30™ chart in isolation, below.
Provided by Livevol
The implied volatility is the forward looking risk in the equity price as reflected by the option market (IV30™ looks forward exactly 30 calendar days).
In English, the red curve is the risk in future stock price movement. I have drawn in those yellow lines and arrows... the point is, as PCLN has grown, has delivered revenues, gross margins and earnings consistently, the risk in the stock as reflected by the option market has been dropping. That makes sense as there does appear to be less and less execution risk in the business model.
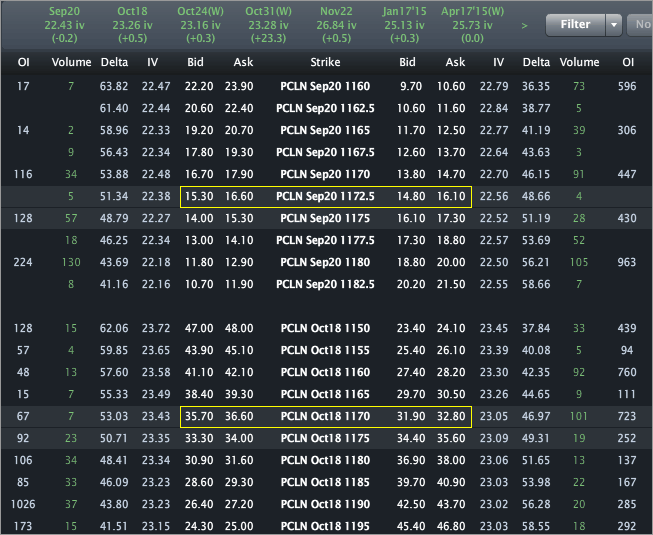
Finally, the Options Tab is included below.
Provided by Livevol
Using the at-the-money (ATM) straddle we can see that the option market reflects a price range of ~[$1140.50, $1204.50] by the end of trading on Sep. 19th.
Using the Oct. options we see a price range of ~[$1104.50, $1240.50].
- If you believe the stock will be outside that range on expiry or any date before then, then you think the volatility is too low.
- If you believe that range is too wide, and that the stock will definitively be in that range on expiration, then you think volatility is too high.
- If you're not sure, and can make an argument for either case, then you think volatility is priced just about right.
This is trade analysis, not a recommendation.
Follow @OphirGottlieb
Tweet
Legal Stuff:
Options involve risk. Prior to buying or selling an option, an investor must receive a copy of Characteristics and Risks of Standardized Options. Investors need a broker to trade options, and must meet suitability requirements.
The information contained on this site is provided for general informational purposes, as a convenience to the readers. The materials are not a substitute for obtaining professional advice from a qualified person, firm or corporation. Consult the appropriate professional advisor for more complete and current information. I am not engaged in rendering any legal or professional services by placing these general informational materials on this website.
I specifically disclaim any liability, whether based in contract, tort, strict liability or otherwise, for any direct, indirect, incidental, consequential, or special damages arising out of or in any way connected with access to or use of the site, even if I have been advised of the possibility of such damages, including liability in connection with mistakes or omissions in, or delays in transmission of, information to or from the user, interruptions in telecommunications connections to the site or viruses.
I make no representations or warranties about the accuracy or completeness of the information contained on this website. Any links provided to other server sites are offered as a matter of convenience and in no way are meant to imply that I endorse, sponsor, promote or am affiliated with the owners of or participants in those sites, or endorse any information contained on those sites, unless expressly stated.


No comments:
Post a Comment