Tuesday, September 30, 2014

9-30-14: End of Day Report

Share on StockTwits


Top Headlines
Dollar climb hits commodities, stocks to close quarter lower

Microsoft skips Windows 9 to emphasize advances

PayPal in Play for Google as Leftover EBay Invites LBO

Top Laboratory Story
Zillow (Z) - The Wonderful Contradiction of Booming Revenue and No Earnings (5 Charts)

Open Interest
Daily Open Interest Report

Biotech Index
Daily Biotech Small & Micro Cap Update

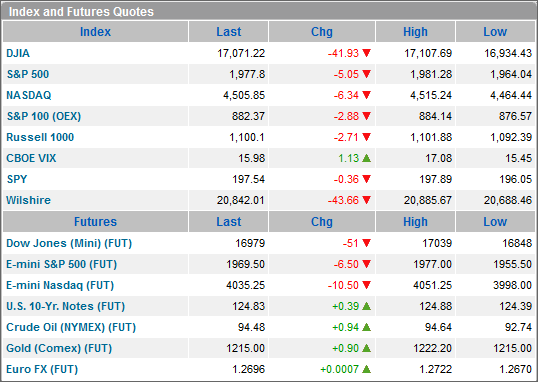
Market Overview

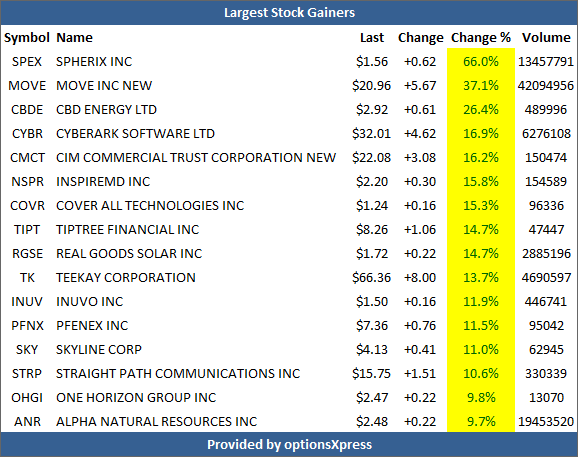
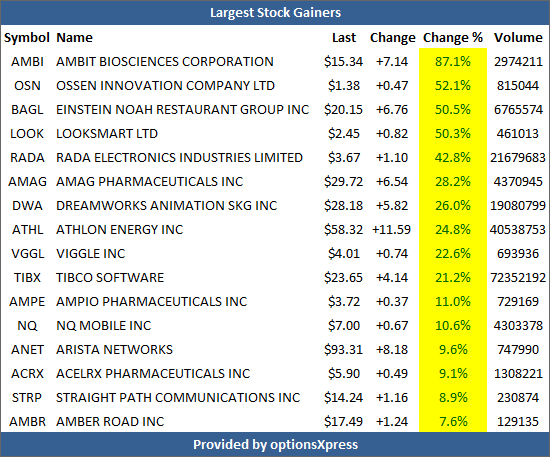
Largest Stock Gainers


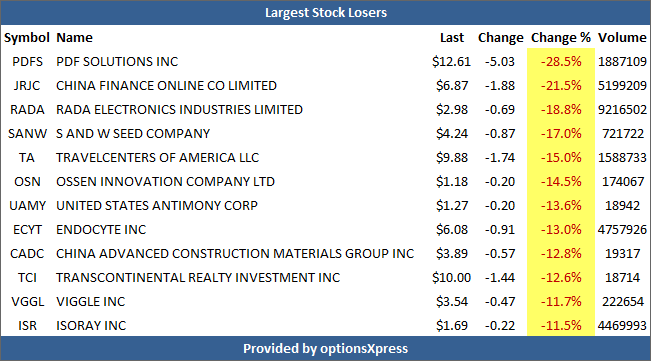
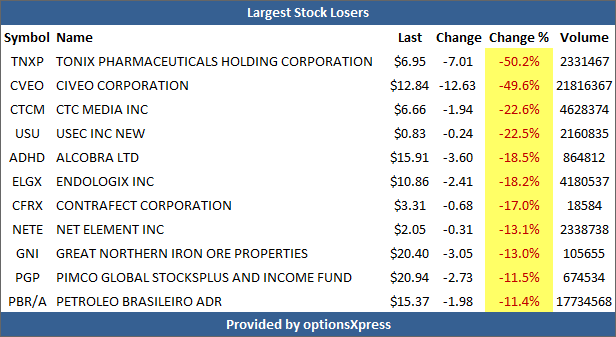
Largest Stock Losers


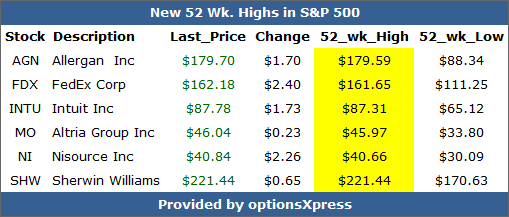
New 52 Wk Highs in S&P 500


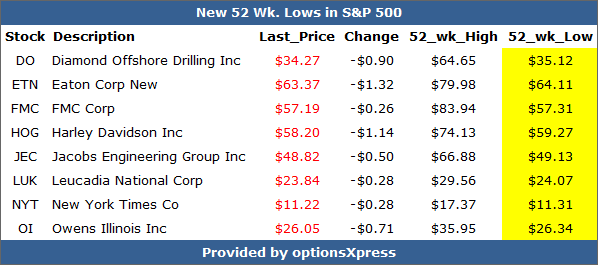
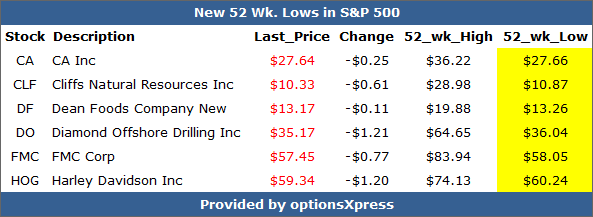
New 52 Wk Lows in S&P 500


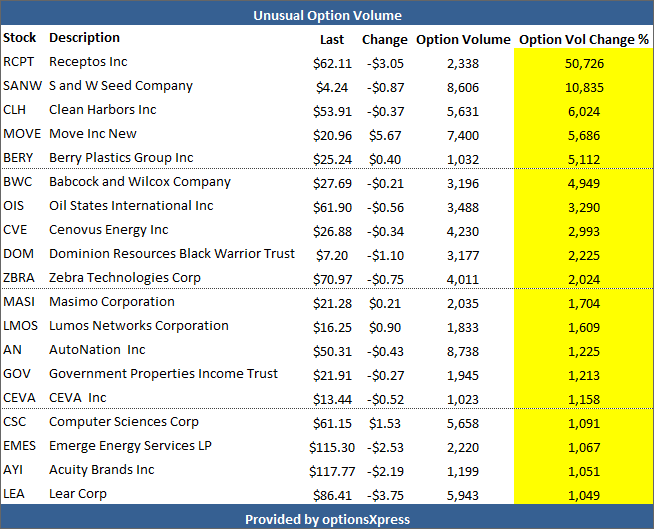
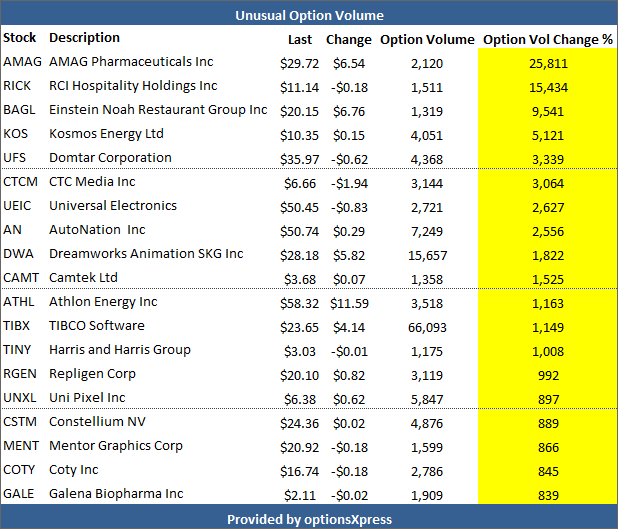
Unusual Option Volume


This is trade analysis, not a recommendation.


Legal Stuff:
Options involve risk. Prior to buying or selling an option, an investor must receive a copy of Characteristics and Risks of Standardized Options. Investors need a broker to trade options, and must meet suitability requirements.

The information contained on this site is provided for general informational purposes, as a convenience to the readers. The materials are not a substitute for obtaining professional advice from a qualified person, firm or corporation. Consult the appropriate professional advisor for more complete and current information. I am not engaged in rendering any legal or professional services by placing these general informational materials on this website.

I specifically disclaim any liability, whether based in contract, tort, strict liability or otherwise, for any direct, indirect, incidental, consequential, or special damages arising out of or in any way connected with access to or use of the site, even if I have been advised of the possibility of such damages, including liability in connection with mistakes or omissions in, or delays in transmission of, information to or from the user, interruptions in telecommunications connections to the site or viruses.

I make no representations or warranties about the accuracy or completeness of the information contained on this website. Any links provided to other server sites are offered as a matter of convenience and in no way are meant to imply that I endorse, sponsor, promote or am affiliated with the owners of or participants in those sites, or endorse any information contained on those sites, unless expressly stated.

9-30-14: Daily Biotech Small & Micro Cap Update

Share on StockTwits

The Ophir Gottlieb Small Cap Biotech Index
Is this the biotech revolution or the biotech bust?


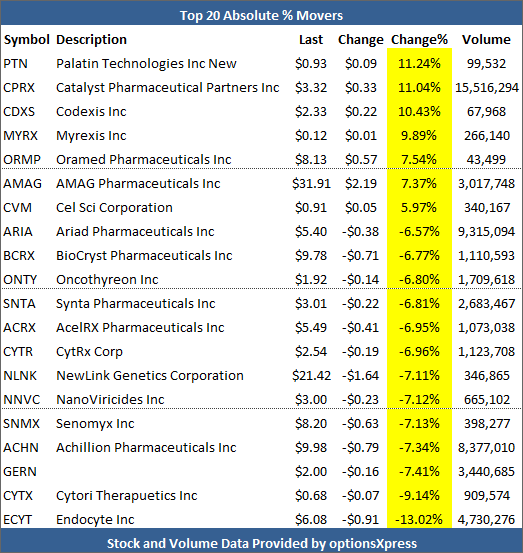
Notable Stock Movers
PTN+11.24%
CPRX+11.04%
CDXS+10.43%
GERN-7.41%
CYTX-9.14%
ECYT-13.02%

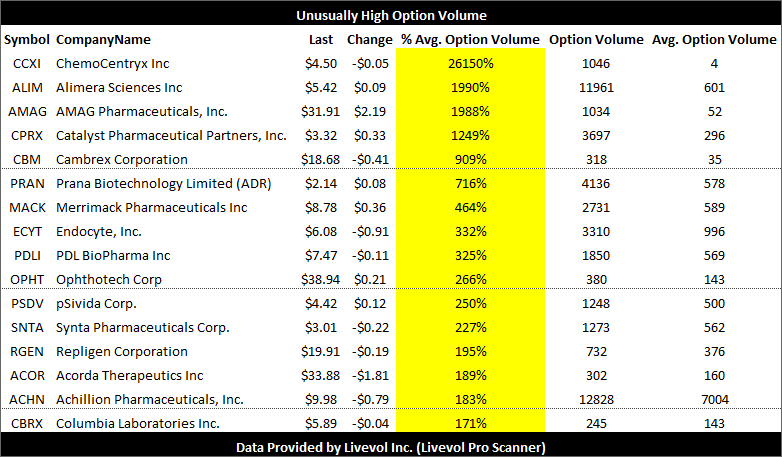
Unusually Heavy Option Volume
CCXI:26150% of daily average
ALIM:1990% of daily average
AMAG:1988% of daily average

231 small / micro cap biotech and pharma companies (equal weighted):
  • Public Biotech and Pharma Companies
  • Trade on North American Exchanges
  • Market Cap Range: [$0, $2 Billion]
  • Price, Employees, Revenue Range: Any

More on index construction and performance: The Ophir Gottlieb Small Cap Biotech Index

Today's Biotech Index Stock Movers


Today's Biotech Index Unusual Option Volume


Full Index Constituents and Moves


This is trade analysis, not a recommendation.


Legal Stuff:
Options involve risk. Prior to buying or selling an option, an investor must receive a copy of Characteristics and Risks of Standardized Options. Investors need a broker to trade options, and must meet suitability requirements.

The information contained on this site is provided for general informational purposes, as a convenience to the readers. The materials are not a substitute for obtaining professional advice from a qualified person, firm or corporation. Consult the appropriate professional advisor for more complete and current information. I am not engaged in rendering any legal or professional services by placing these general informational materials on this website.

I specifically disclaim any liability, whether based in contract, tort, strict liability or otherwise, for any direct, indirect, incidental, consequential, or special damages arising out of or in any way connected with access to or use of the site, even if I have been advised of the possibility of such damages, including liability in connection with mistakes or omissions in, or delays in transmission of, information to or from the user, interruptions in telecommunications connections to the site or viruses.

I make no representations or warranties about the accuracy or completeness of the information contained on this website. Any links provided to other server sites are offered as a matter of convenience and in no way are meant to imply that I endorse, sponsor, promote or am affiliated with the owners of or participants in those sites, or endorse any information contained on those sites, unless expressly stated.

* Zillow (Z) - Booming Revenue but No Earnings... and a Misrepresentation of User-base?


Share on StockTwits


The visualization of data is provided by Capital Market Laboratories (CML).

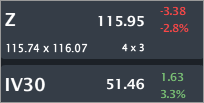
Z is trading $115.95, down 2.8% with IV30™ up 3.3%. The Symbol Summary is included below.
Provided by Livevol

Disclosure: The Governance Investors hedge fund is short Z stock.

Even Twitter claims fewer monthly unique users in the US than Zillow


Conclusion
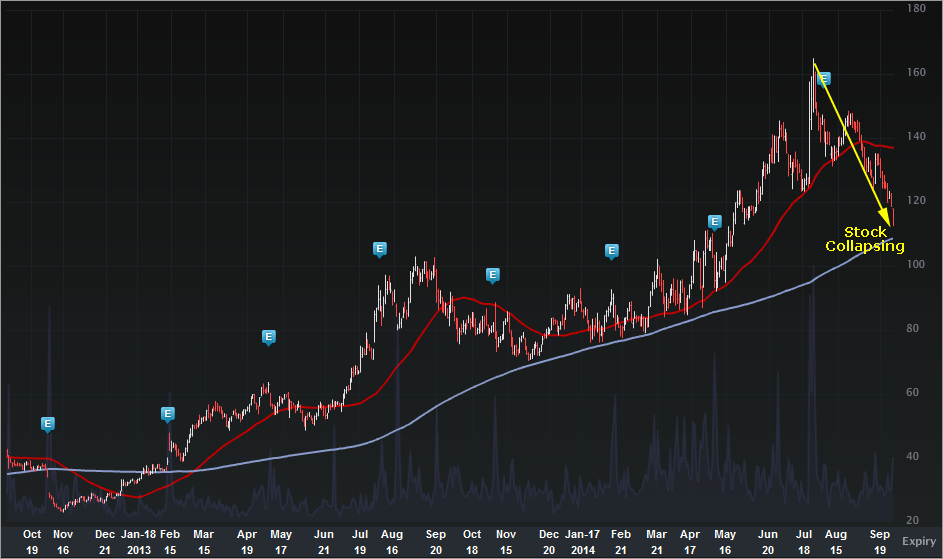
Z stock peaked at the end of July at $164.90 and since then has fallen 27%. Just after the peak in stock price, the firm released earnings which then saw the stock drop, recover a little, and now slipped into free fall, below the 50-day MA and inches from the 200-day MA.

If we visualize the financial measures surrounding Z, we can see some fascinating trends and we do truly get the good, bad and ugly.

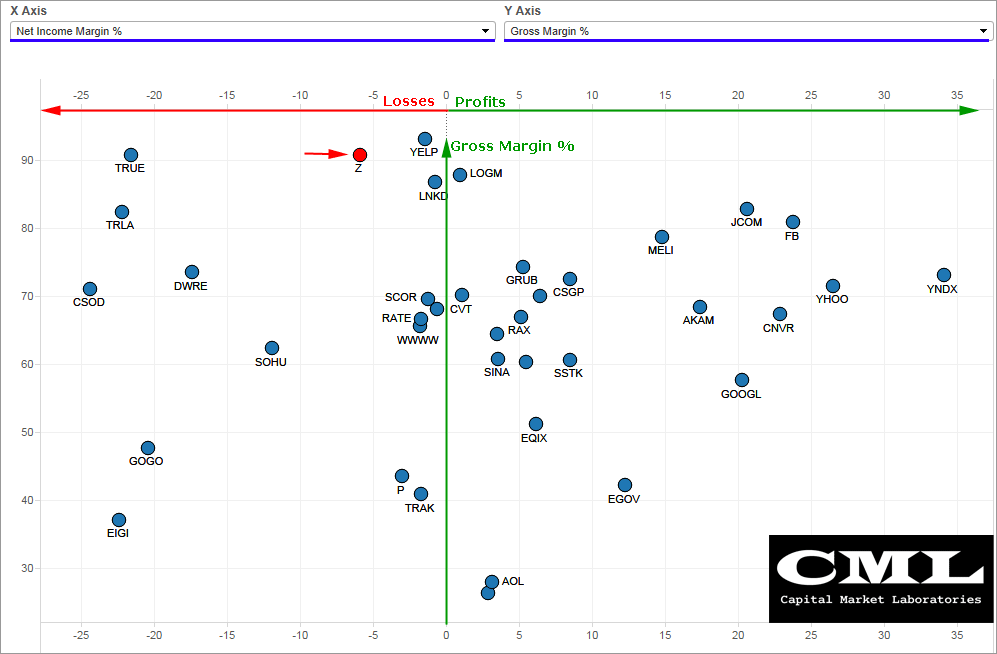
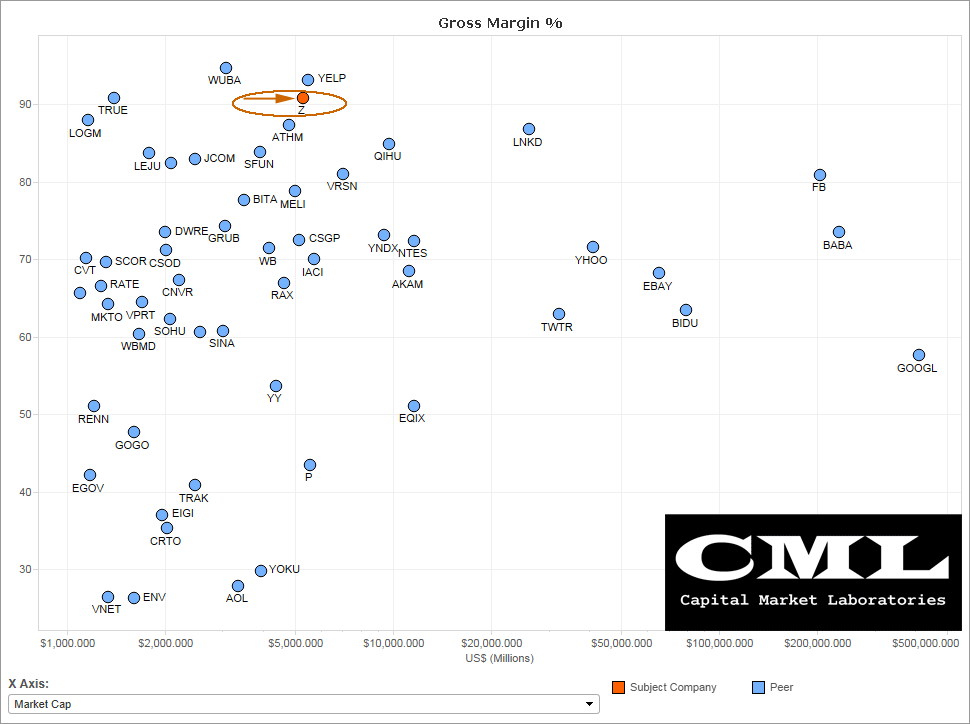
Let's start off with an 'X-Y' factor plot from CML: Net Income Margin % on the x-axis, Gross Margin % on the y-axis.

We can see that while Z has enormous gross margin % (over 90%), that has not yet translated into positive earnings.

The two-year stock chart is included below.
Provided by Livevol

We can see that peak in the stock and what has now turned into a free fall.  Let's turn back to the visualizations of the financial measures, and we can see what a confusing situation the firm is in.

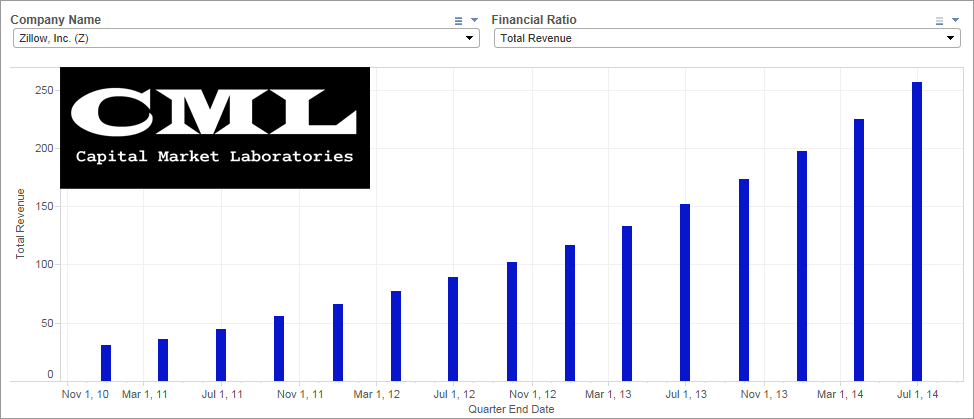
Total Revenue (TTM)
This is a beautiful chart -- even the shape is somehow appealing (check if there is a golden ratio in there).  In any case, Z revenue is booming to now over $250M in the trailing twelve months.


Gross Margin % (Comp to Peers)
No matter how you look at it, the gross margin % Z achieves as an Internet Software and Services Firm is tremendously high.  In fact, I can't imagine it getting better.


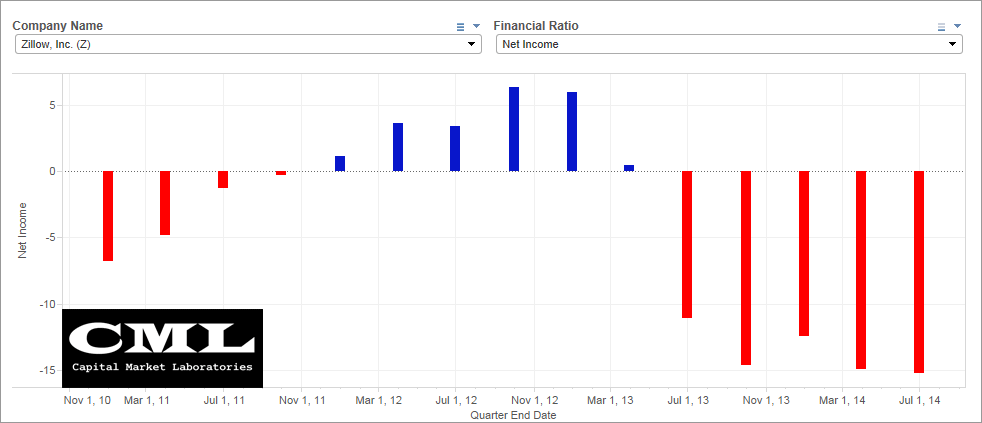
Net Income (TTM)
With revenue booming and gross margin % at exceptional levels, it would seem profits are near... In fact, when we look at the time series, net income is negative and not growing.  But, this is a huge caveat, note the y-axis.  Losses are pretty small on the scale of revenue (~$15M in losses on $250M in revenue).


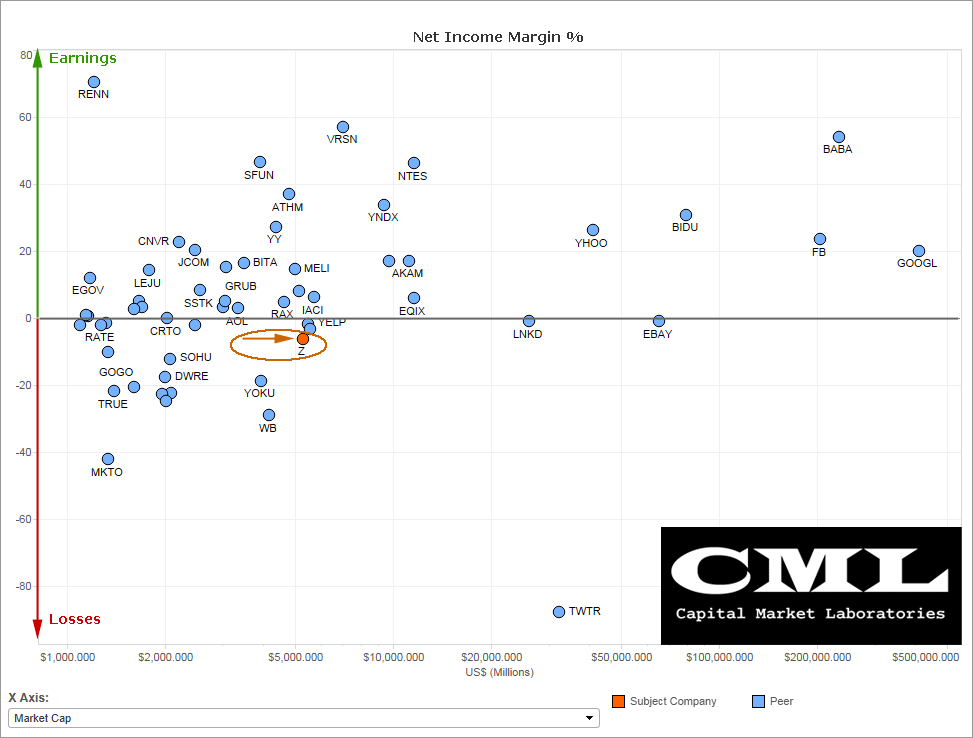
Net Income Margin % (Comp to Peers)
The losses that Z is facing (as a percentage of revenue) are significantly worse than many of its peers.


So that's the financial measures side... Here is the option market.

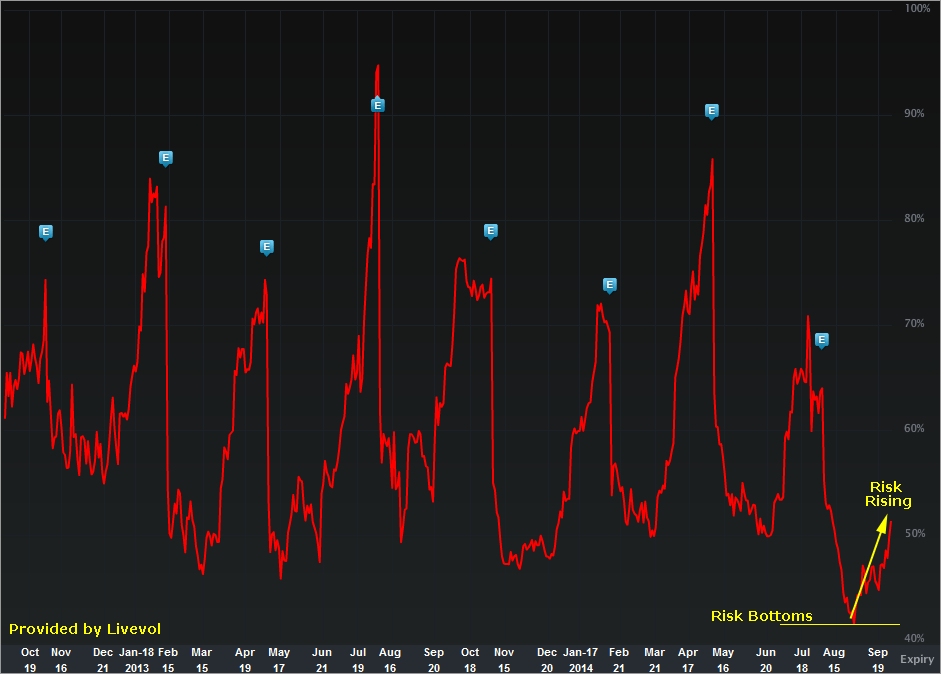
Let's turn to the IV30™ chart in isolation, below.
Provided by Livevol

The implied volatility is the forward looking risk in the equity price as reflected by the option market (IV30™ looks forward exactly 30 calendar days).

In English, the red curve is the risk in future stock price movement.  We can see two wonderful phenomena:

1. The risk bottom out to an unprecedented level not too long ago.
In fact, on Aug 12, I wrote: Z - Misrepresenting User Base? Is Option Market Under-pricing Risk... By a Lot?

----
Zillow only covers the US real estate market, and there are only 121 million households in the US, which means that if Zillow really had 89 million monthly unique users, 74% of all US households would be visiting Zillow every single month. Moreover, existing home sales are currently only running at about a 5m unit annual pace. Are 18x that many people really using Zillow each month? Even Twitter claims fewer monthly unique users in the US than Zillow, and Facebook claims just 2.3x more.

[]

Sure enough if you look at Zillow’s 10-K or Q, they imply that the monthly unique data probably overstates its user count.

Source: Is Zillow overstating the size of its user base?
----

2. The risk has shot up as the stock has dropped.  Although, let's keep in mind, the overall level of risk is still pretty low given the last two-years of history.

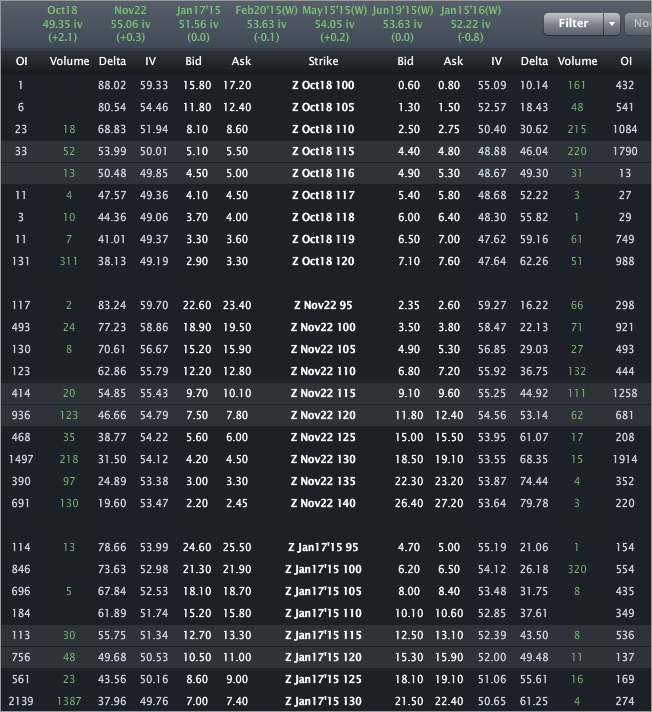
Finally, the Options Tab is included below.
Provided by Livevol

Using the at-the-money (ATM) straddle we can see that the option market reflects a price range of [$106.50, $125.50] by the end of trading on October 17th.


  • If you believe the stock will be outside that range on expiry or any date before then, then you think the volatility is too low.
  • If you believe that range is too wide, and that the stock will definitively be in that range on expiration, then you think volatility is too high.
  • If you're not sure, and can make an argument for either case, then you think volatility is priced just about right.


This is trade analysis, not a recommendation.


Legal Stuff:
Options involve risk. Prior to buying or selling an option, an investor must receive a copy of Characteristics and Risks of Standardized Options. Investors need a broker to trade options, and must meet suitability requirements.

The information contained on this site is provided for general informational purposes, as a convenience to the readers. The materials are not a substitute for obtaining professional advice from a qualified person, firm or corporation. Consult the appropriate professional advisor for more complete and current information. I am not engaged in rendering any legal or professional services by placing these general informational materials on this website.

I specifically disclaim any liability, whether based in contract, tort, strict liability or otherwise, for any direct, indirect, incidental, consequential, or special damages arising out of or in any way connected with access to or use of the site, even if I have been advised of the possibility of such damages, including liability in connection with mistakes or omissions in, or delays in transmission of, information to or from the user, interruptions in telecommunications connections to the site or viruses.

I make no representations or warranties about the accuracy or completeness of the information contained on this website. Any links provided to other server sites are offered as a matter of convenience and in no way are meant to imply that I endorse, sponsor, promote or am affiliated with the owners of or participants in those sites, or endorse any information contained on those sites, unless expressly stated.

9-30-14: Daily Open Interest Report

Share on StockTwits

Daily Option Interest Report

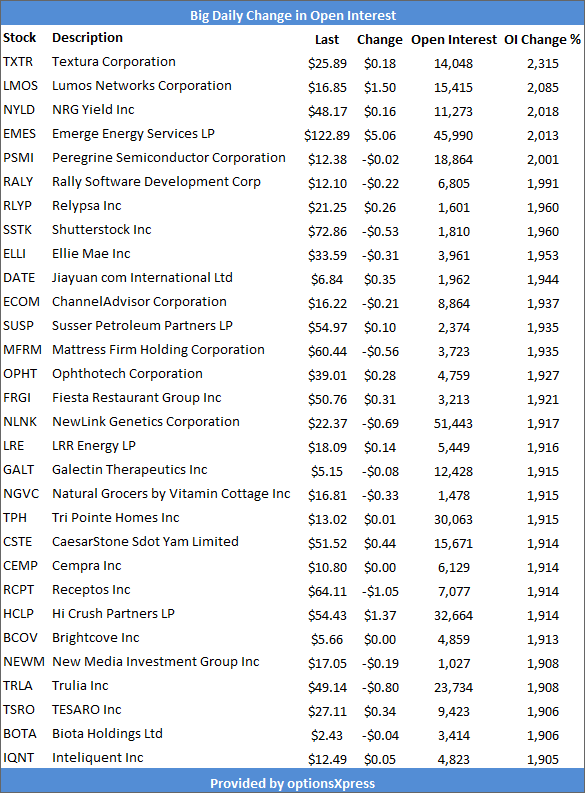
Notable One-day Option Position Increases
TXTR+2315%
LMOS+2085%
NYLD+2018%
Full List Below

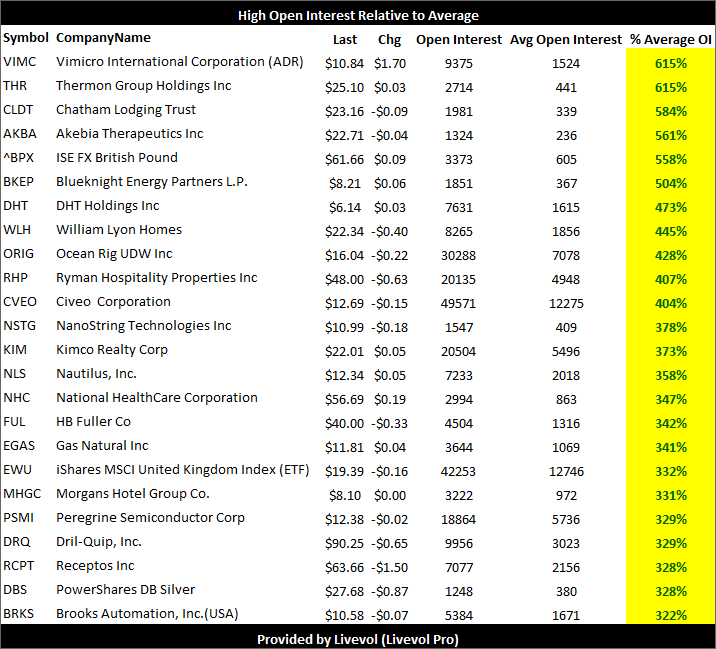
Notable Large Option Position Increases Relative to 3-month Average
VIMC+615%
THR+615%
CLDT+584%
Full List Below

Largest One-day Open Interest Increases


Largest Current Open Interest Relative to 90-day Average


This is trade analysis, not a recommendation.


Legal Stuff:
Options involve risk. Prior to buying or selling an option, an investor must receive a copy of Characteristics and Risks of Standardized Options. Investors need a broker to trade options, and must meet suitability requirements.

The information contained on this site is provided for general informational purposes, as a convenience to the readers. The materials are not a substitute for obtaining professional advice from a qualified person, firm or corporation. Consult the appropriate professional advisor for more complete and current information. I am not engaged in rendering any legal or professional services by placing these general informational materials on this website.

I specifically disclaim any liability, whether based in contract, tort, strict liability or otherwise, for any direct, indirect, incidental, consequential, or special damages arising out of or in any way connected with access to or use of the site, even if I have been advised of the possibility of such damages, including liability in connection with mistakes or omissions in, or delays in transmission of, information to or from the user, interruptions in telecommunications connections to the site or viruses.

I make no representations or warranties about the accuracy or completeness of the information contained on this website. Any links provided to other server sites are offered as a matter of convenience and in no way are meant to imply that I endorse, sponsor, promote or am affiliated with the owners of or participants in those sites, or endorse any information contained on those sites, unless expressly stated.
Monday, September 29, 2014

9-29-14: End of Day Reports

Share on StockTwits


Top Headlines
Stocks try to regain footing after Hong Kong unrest sends them lower

Why the next global crisis may stem from China

Ruble Drops to Record as Central Bank Intervention Level Nears

Top Laboratory Story
GoPro (GPRO) - What "Hard-to-Borrow", "REG SHO" and Visualizations Tell Us About a 260% Stock Rise

Alibaba (BABA) - Silence the Noise; Introduction to Facts & Glaring Questions (5 Charts)

Open Interest
Daily Open Interest Report

Biotech Index
Daily Biotech Small & Micro Cap Update

Market Overview

Largest Stock Gainers


Largest Stock Losers


New 52 Wk Highs in S&P 500


New 52 Wk Lows in S&P 500


Unusual Option Volume


This is trade analysis, not a recommendation.


Legal Stuff:
Options involve risk. Prior to buying or selling an option, an investor must receive a copy of Characteristics and Risks of Standardized Options. Investors need a broker to trade options, and must meet suitability requirements.

The information contained on this site is provided for general informational purposes, as a convenience to the readers. The materials are not a substitute for obtaining professional advice from a qualified person, firm or corporation. Consult the appropriate professional advisor for more complete and current information. I am not engaged in rendering any legal or professional services by placing these general informational materials on this website.

I specifically disclaim any liability, whether based in contract, tort, strict liability or otherwise, for any direct, indirect, incidental, consequential, or special damages arising out of or in any way connected with access to or use of the site, even if I have been advised of the possibility of such damages, including liability in connection with mistakes or omissions in, or delays in transmission of, information to or from the user, interruptions in telecommunications connections to the site or viruses.

I make no representations or warranties about the accuracy or completeness of the information contained on this website. Any links provided to other server sites are offered as a matter of convenience and in no way are meant to imply that I endorse, sponsor, promote or am affiliated with the owners of or participants in those sites, or endorse any information contained on those sites, unless expressly stated.