| Tweet |  |  |
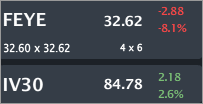
FEYE is trading $32.62, down 8.1% with IV30™ up 2.6%. The Symbol Summary is included below.

Provided by Livevol
This is an earnings preview, volatility and stock note and is just one in the series for this earnings season. To date, the option market in general has under-priced risk in most of the names I have discussed, meaning the stock prices have moved more than the amount the option market was pricing. Here's a quick list:
Disclosure: The hedge fund is (has been) naked short FEYE. That doesn't mean the stock will go down (or up), it just means... 'the hedge fund is (has been) naked short FEYE.' I'm not licensed to give advice nor is anything I ever write intended to be advice to buy, sell, hold (or anything else) on any security ever.
Conclusion
As the market has been declining and momentum has turned totally upside down, the risk in the option market is also increasing and that increase is now reflected in single stock names (like FEYE). What once was a rather obvious under-pricing of risk is turning. FEYE risk into earnings isn't obviously low (or high), but there's still a lot we can see ahead of the event
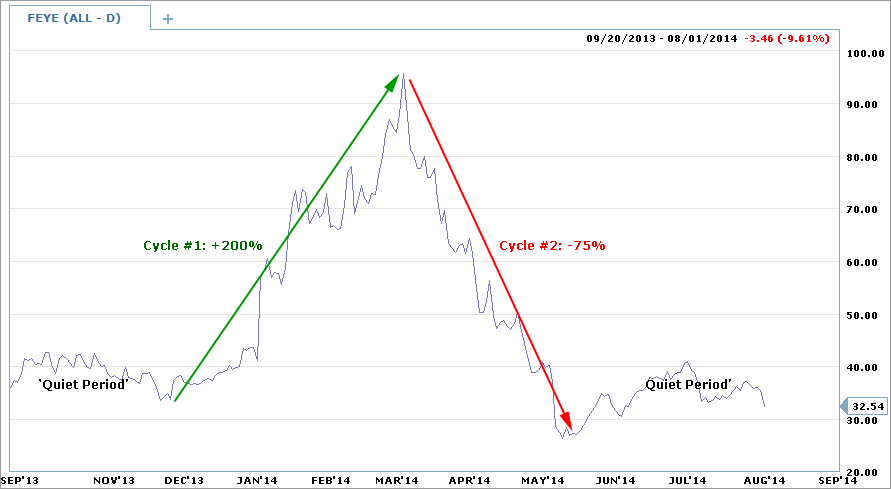
The all-time stock chart for FEYE is included below.

Provided by Charles Schwab optionsXpress
The stock has had essentially two cycles (see chart):
Cycle #1: A rise from ~$33 to $97.35 (~+200%) in about four-months.
Cycle #2: A drop from $97.35 to $25.58 (~-74%) in about two-months.
The stock is down 9.6% since IPO as of this writing.
There is in fact a third cycle if we look closely. That cycle has happened twice, and I call it "the quiet period.' For FEYE, the questions are simply:
- When does the quiet period end?
- How big a move is there in the next 'moving' cycle?
- Which direction will it move?
Obviously, I don't know the answer to any of these other than to bet on our model which, no matter how fancy it is, is speculation.
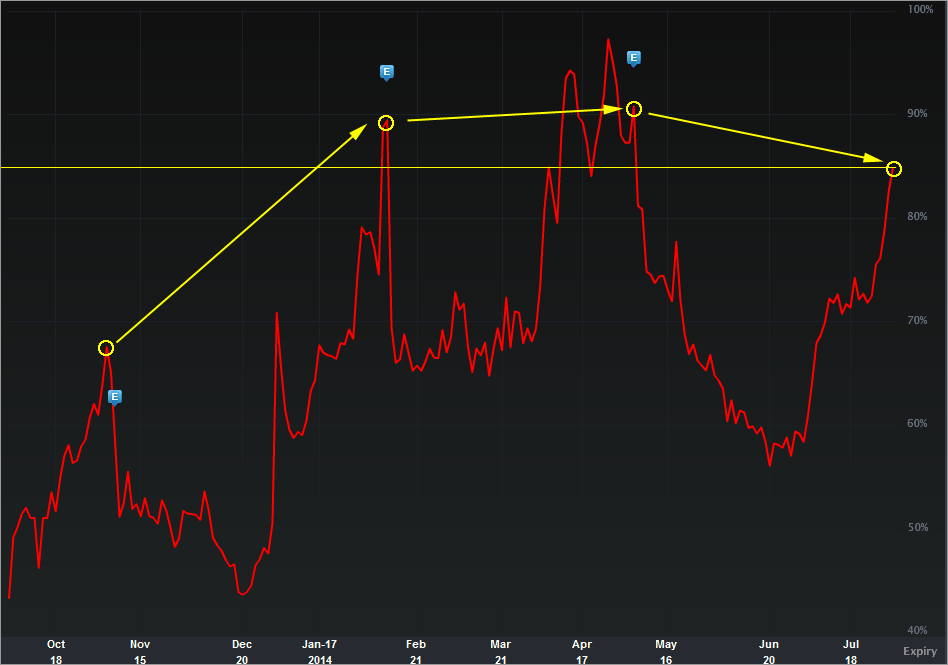
Let's turn to the IV30™ chart in isolation, below.

Provided by Livevol
The implied volatility is the forward looking risk in the equity price as reflected by the option market (IV30™ looks forward exactly 30 calendar days).
In English, the red curve is the risk in future stock price movement. The blue "E" icons represent earnings dates (highlighted in yellow), and we can see that risk has increased into earnings after the first release, and for now seems right about at the level it hit in the last earnings release when the stock gapped down from $37.13 to $28.65 in a day.
It's that last move down on earnings that I believe is keeping the earnings risk (implied volatility elevated) about the same. Earnings aren't due out until 8-5-2015 (AMC), so that red curve should risk a bit just ahead of the event.
End result: The risk into this earnings release is about the same as the last, which was an all-time high in risk.
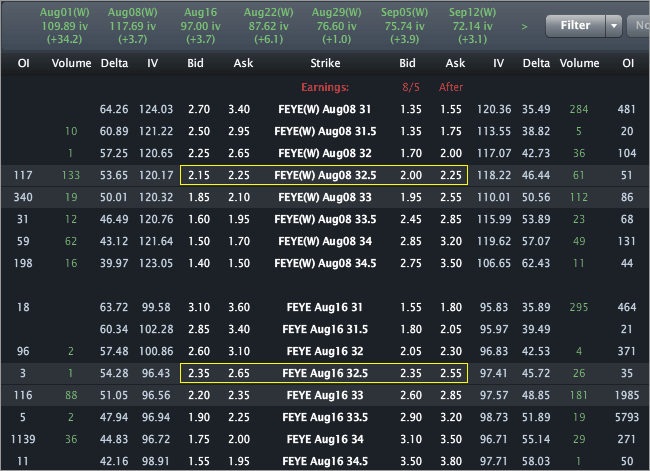
Finally, the Options Tab is included below.

Provided by Livevol
Using the at-the-money (ATM) straddle in the Aug8 weekly options we can see that the option market reflects a price range of ~[$28.30, $36.70].
Using the Aug15 monthly options, that range is ~[$27.50, $37.50].
- If you believe the stock will be outside that range on expiry or any date before then, then you think the volatility is too low.
- If you believe that range is too wide, and that the stock will definitively be in that range on expiration, then you think volatility is too high.
- If you're not sure, and can make an argument for either case, then you think volatility is priced just about right.
Final note: Don't bet on this earnings event or this stock simply because I am. My model is my bet, it shouldn't be yours.
This is trade analysis, not a recommendation.
Follow @OphirGottlieb
Tweet
Legal Stuff:
Options involve risk. Prior to buying or selling an option, an investor must receive a copy of Characteristics and Risks of Standardized Options. Investors need a broker to trade options, and must meet suitability requirements.
The information contained on this site is provided for general informational purposes, as a convenience to the readers. The materials are not a substitute for obtaining professional advice from a qualified person, firm or corporation. Consult the appropriate professional advisor for more complete and current information. I am not engaged in rendering any legal or professional services by placing these general informational materials on this website.
I specifically disclaim any liability, whether based in contract, tort, strict liability or otherwise, for any direct, indirect, incidental, consequential, or special damages arising out of or in any way connected with access to or use of the site, even if I have been advised of the possibility of such damages, including liability in connection with mistakes or omissions in, or delays in transmission of, information to or from the user, interruptions in telecommunications connections to the site or viruses.
I make no representations or warranties about the accuracy or completeness of the information contained on this website. Any links provided to other server sites are offered as a matter of convenience and in no way are meant to imply that I endorse, sponsor, promote or am affiliated with the owners of or participants in those sites, or endorse any information contained on those sites, unless expressly stated.


No comments:
Post a Comment