| Tweet | Follow @OphirGottlieb |  |

TWTR is trading $46.05, up small with IV30™ up 1.3%. The Symbol Summary is included below.
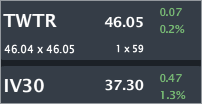
Provided by Livevol
Conclusion
This is a $27B firm with no earnings, questionable user growth, questionable metrics to measure user growth and interactivity, the worst earnings of all peers measured as net income, net income margins, earnings from continuing operations, EBITDA to total assets and basically every other measure you can think of.
Even worse, it's operating revenue to operating expenses is unbelievably low -- the firm is essentially spending $2 to earn $1 in revenue.
So it's just total lunacy that's it's worth $27B, right?
Actually, this is also a firm with the largest unlevered free cash low relative to revenue than any peer. It has the largest 1-year growth in cash from operations relative to peers, it's investing more in R&D than any other peer and it's growing its investment in R&D more than any other firm. Finally, TWTR's assets are growing faster than any other peer.
Still convinced you know what TWTR is worth?
Yeah, me either.
This is a second post (The first report covered TSLA:
TSLA - A Depth of Analysis Like Never Before & 10 Charts That Will Blow Your Mind) in a series that looks to do analysis well beyond the rather surface commentary that has found its way around social media and established news organizations.
Bull or Bear: Your Conviction in TWTR May be in Error.
Last week we looked at the option market and saw
TWTR - Unprecedented: Risk Breaks All-time Lows; Stock Moves in Huge Cycles
Today we will step away from the option market and do an in depth analysis of what's really going on with TWTR.
First, just to get it out of the way, here is TWTR's revenue growth (TTM).

But this ain't the story, we already know that...
I. Peer Group
The first (real) step is to identify a peer group that looks at least something like our subject company, which for TWTR is far from trivial. With over 26,000 active firms to choose from, we had some work to do. Ultimately, I found a very satisfying peer group with firms in the same region, country, industry and with similar market caps, revenue and assets.
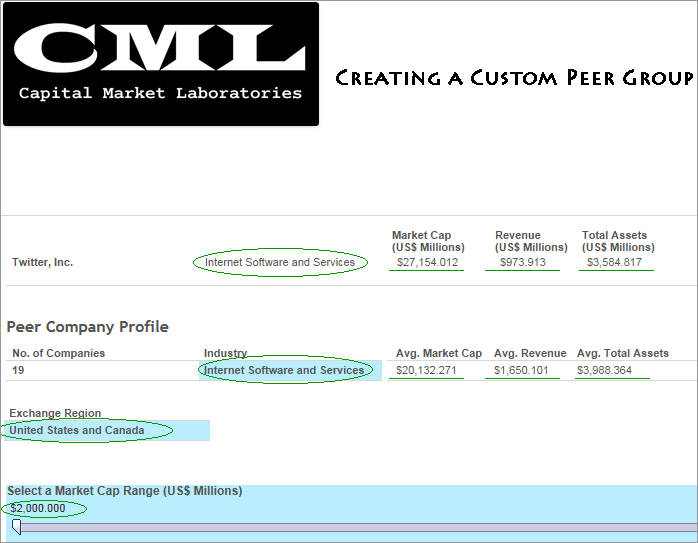
Here's how I did it:
- Industry: Internet Software & Services
- Region: North America
- Market Cap > $2B
- Remove Manually: GOOG, EBAY... about 10 others.
This left us with a peer group of 19 companies that are similar to TWTR in several ways, namely:
- Same Industry.
- Same Region.
- Similar Market Cap: TWTR is $27B vs. peer group of $20B.
- Revenue: ~$1B for TWTR vs. an average of $1.6B for the peer group.
- Total Assets: $3.6B for TWTR vs. an average of $4B for the peer group.
That's very satisfying, even though there are some obvious difficulties still... Now we can do some analysis.
-------------------- ANALYSIS --------------------
II. Financial Statement Comparisons
While there are millions rows of data for TWTR and its peers, it only takes us ~10 seconds to figure out where we should be looking:
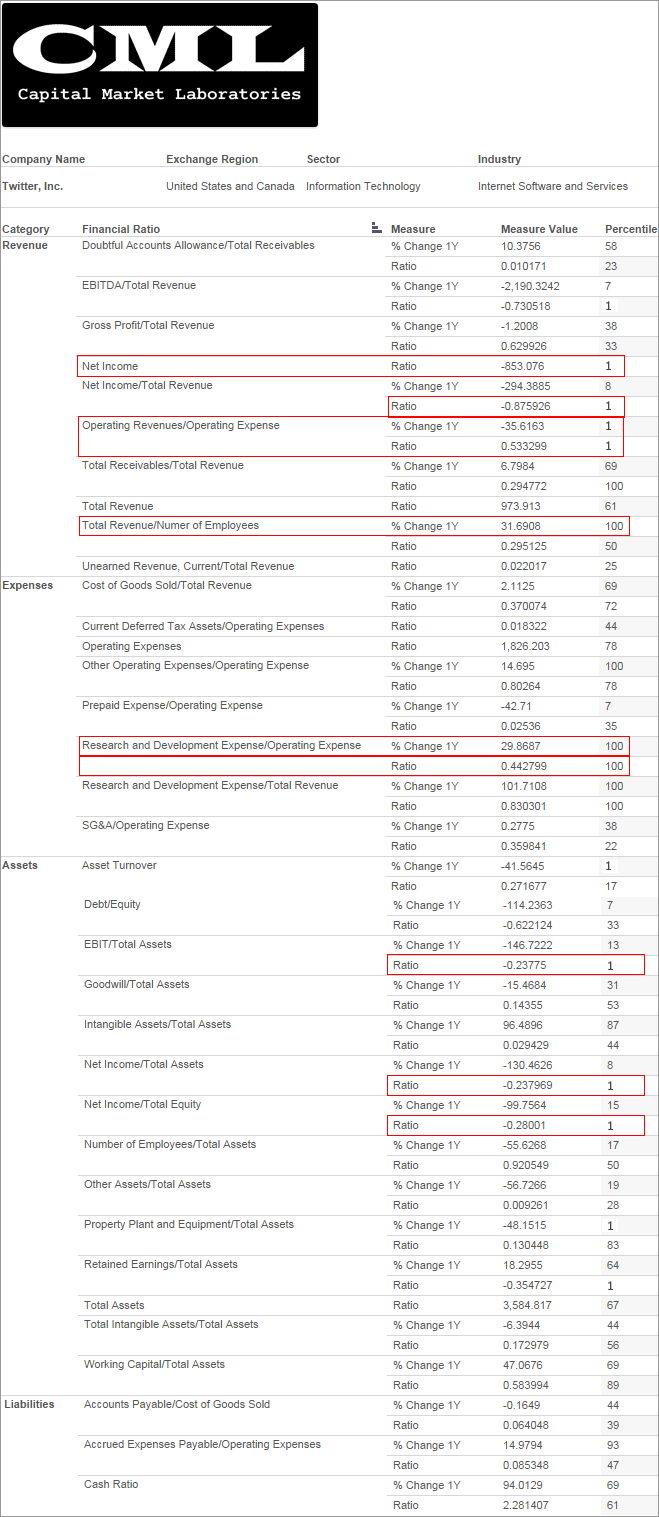
Very quickly we can see TWTR is either the highest or lowest in several categories.

- The firm is showing the worst Net Income on almost every measure possible.
- The firm is spending more on Research & Development on almost any measure possible.
III. Earnings & Growth Comparisons
Again, while there is nearly endless data for TWTR alone (not to mention its peers), it only takes us ~10 seconds to figure out where we should be looking when it comes to earnings & growth measures:
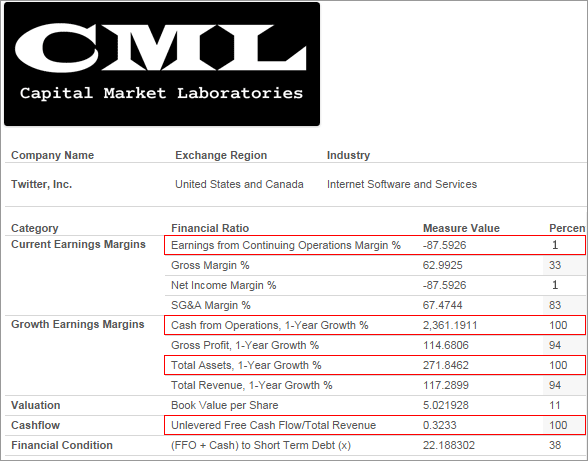
Very quickly we can see TWTR is either the highest or lowest in several categories.

While the financial statement analysis wasn't so surprising...
- Did you know that TWTR has the highest 1-year growth in cash from operations?
- Did you know that TWTR has the highest Unlevered Free Cash Flow / Total Revenue?
Yeah, me either...
IV. Visualizations
Data is just data if you can't do something with it. That "something" is visualizations. We'll look at a few selected measures, and the differences between TWTR and every other firm, which are remarkable if not breathtaking.
* Earnings (part one)
EBITDA (worst)
We can see below that TWTR shows the worst EBITDA than any peer... by a lot.
The top horizontal chart shows us the distribution and that TWTR is all by itself. The scatter plot shows us the actual names.
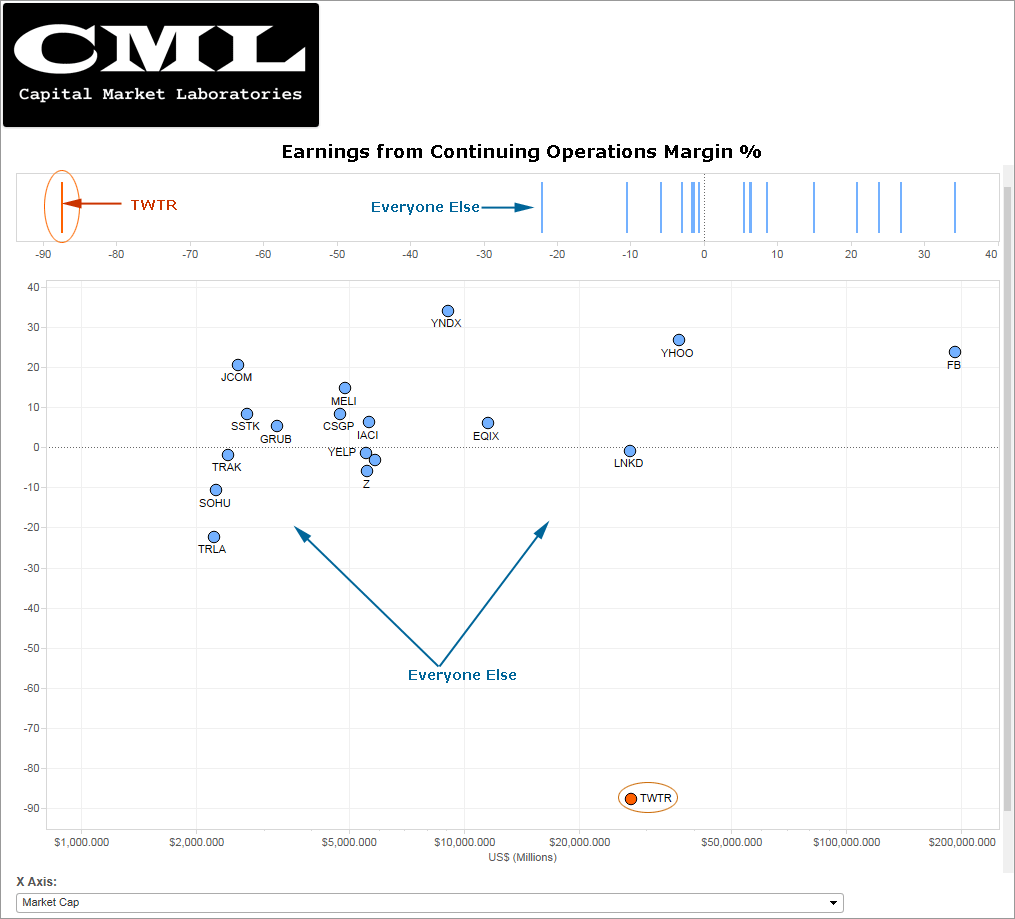
Fact #1: TWTR has the lowest EBITDA of all its peers. "Bad."
Operating Revenue / Operating Expenses (worst)
At some point, for a company to turn a profit, Revenue:Expenses must be greater than 1. As of right now TWTR sits at ~0.53, which is atrocious (the firm is spending $2 to earn $1).
The horizontal chart illustrates where TWTR sits relative to the peer group. It is in the 1st percentile, aka, it's the lowest.
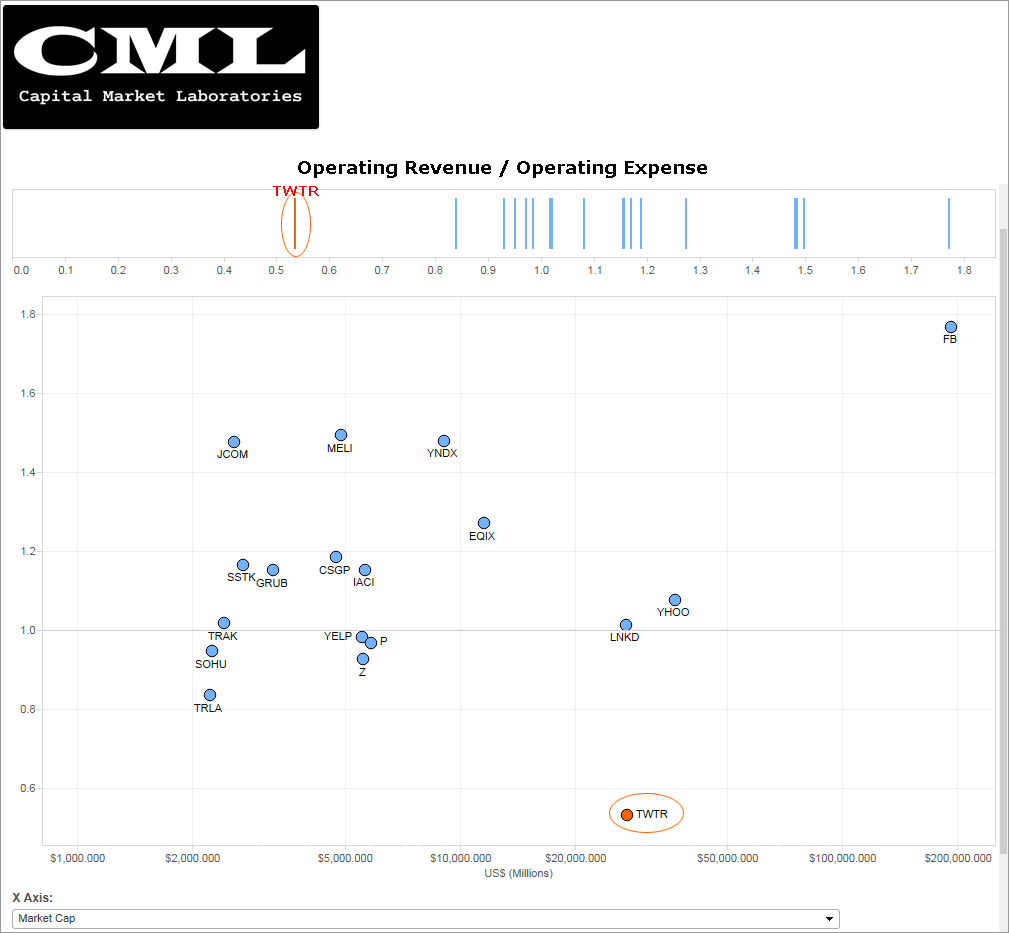
Fact #2: TWTR has the lowest operating margins of all its peers. "Bad."
* Expenses
Research & Development / Operating Expenses (highest)
TWTR is investing (expensing) more in Research & Development than any other peer. We can see that the firm is in the '100'th percentile, we can see the distribution in the horizontal chart and of course, we can see the actual scatter below that.
While TWTR shows the largest R&D 'expense,' I would say this is good news, otherwise, we looking at a firm that is simply hemorrhaging earnings with no future. That is NOT the case with TWTR.
Check out how huge that distribution is; there's TWTR and then there's everyone else.
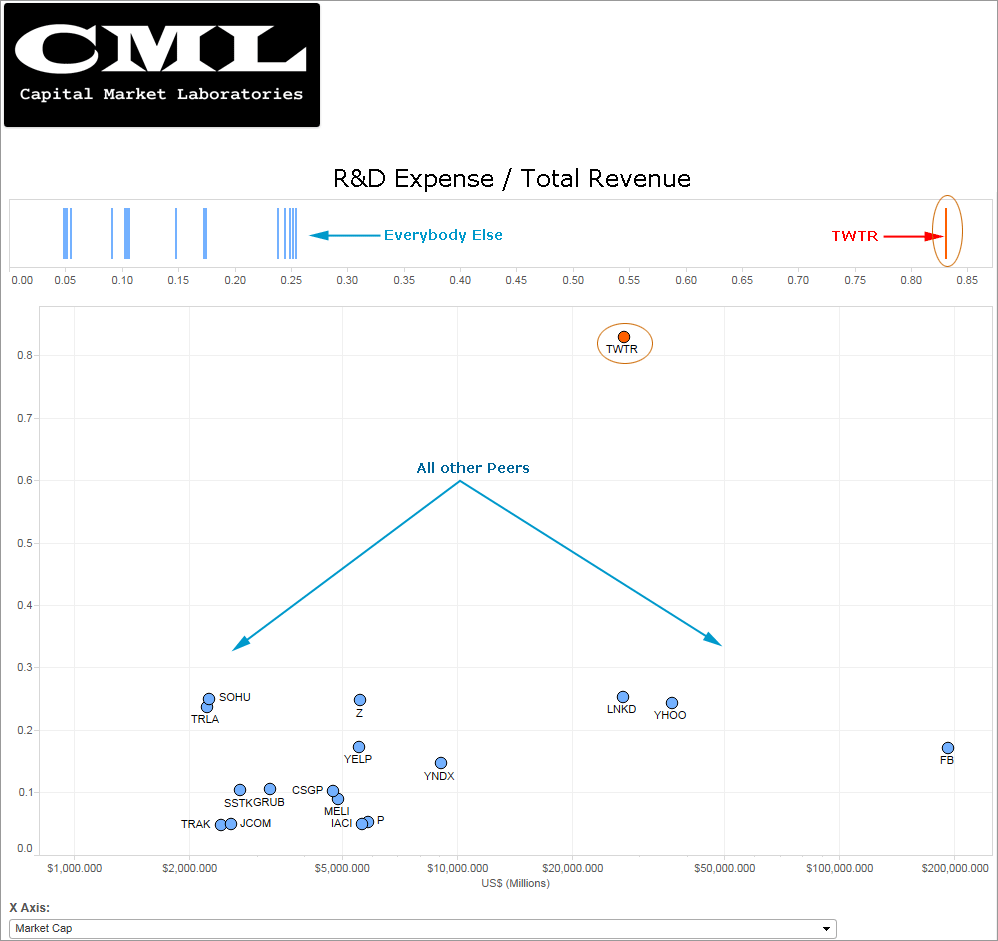
Fact #3: TWTR is spending the most in Research & Development relative to revenue than any other peer and the one-year growth in that expense is greater than any other peer. "Good."
* Earnings (part two)
While we have seen some awful data surrounding earnings, there is some incredibly different data that paints a wildly different picture.
Cash from Operations, 1-year Growth (best)
This is the first of three charts that, for lack of a better word, shocked me about TWTR.
Look at the distribution (the horizontal chart), and how far TWTR is from every other peer with respect to the one-year growth in cash from operations.
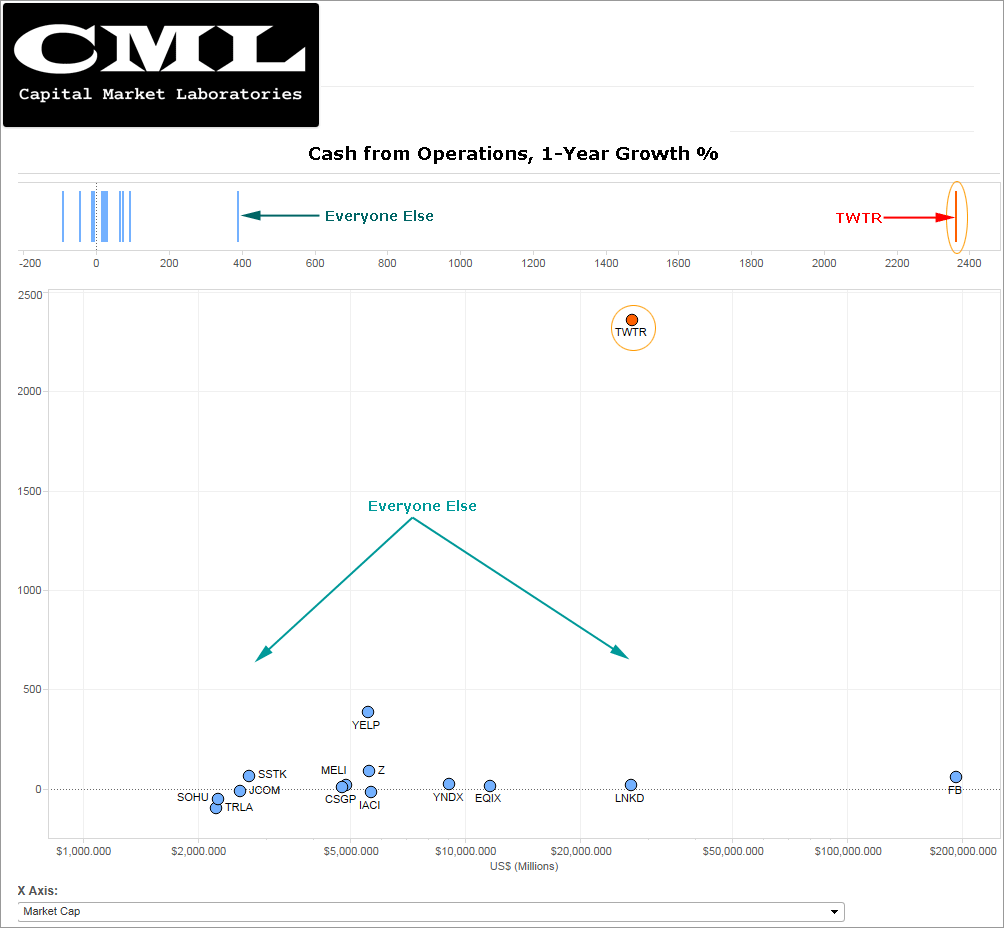
Fact #4: TWTR has the highest 1-year growth cash from operations relative to any peer... and it's not even close. "Good."
Unlevered Free Cash Flow / Total Revenue (best)
This is the second of three charts that shocked me about TWTR.
For a company that has been slammed for no earnings (true), horrific operating margins (really true), no substantial metrics in place to measure user interactivity growth... Did you know that in the purest of all earnings measures (free cash flow), TWTR is better than every other peer?
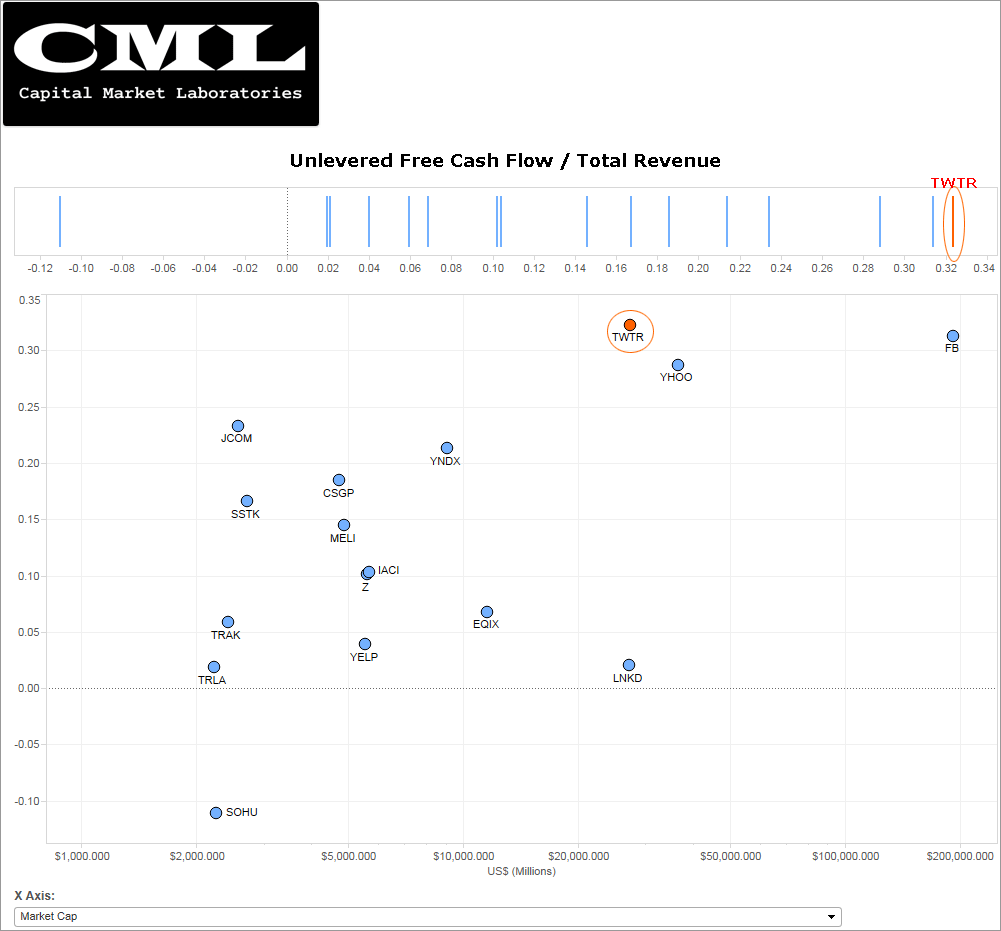
Fact #5: TWTR has the highest Free Cash Flow relative to Total revenue than any other peer. "Good."
Total Asset Growth, 1-year (best)
This is the final of three charts that shocked me about TWTR.
I expected the firm to be growing assets faster than all peers, again, if not, then what exactly are we looking at here as a company?... But check out that distribution relative to peers in that horizontal chart. There's TWTR, and then there's everyone else.
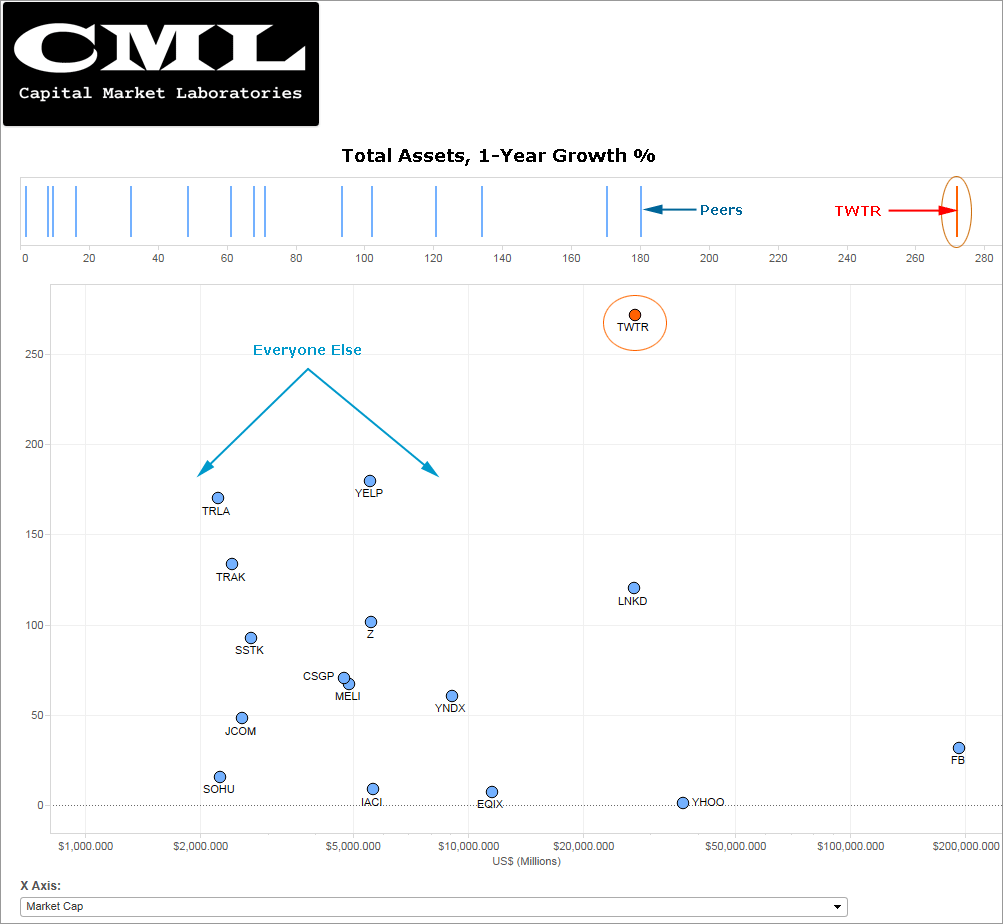
Fact #6: TWTR has the highest 1-year Asset Growth relative to any other peer. "Good."
Conclusion
This is a $27B firm with no earnings, questionable user growth, questionable metrics to measure user growth and interactivity, the worst earnings of all peers measured as net income, net income margins, earnings from continuing operations, EBITDA to total assets and basically every other measure you can think of.
Even worse, it's operating revenue to operating expenses is unbelievably low -- the firm is essentially spending $2 to earn $1 in revenue.
So it's just total lunacy that's it's worth $27B, right?
Actually, this is also a firm with the largest unlevered free cash low relative to revenue than any peer. It has the largest 1-year growth in cash from operations relative to peers, it's investing more in R&D than any other peer and it's growing its investment in R&D than any other firm. Finally, TWTR's assets are growing faster than any other peer.
Still convinced you know what TWTR is worth?
Yeah, me either.
This is trade analysis, not a recommendation.
Follow @OphirGottlieb
Tweet
Legal Stuff:
Options involve risk. Prior to buying or selling an option, an investor must receive a copy of Characteristics and Risks of Standardized Options. Investors need a broker to trade options, and must meet suitability requirements.
The information contained on this site is provided for general informational purposes, as a convenience to the readers. The materials are not a substitute for obtaining professional advice from a qualified person, firm or corporation. Consult the appropriate professional advisor for more complete and current information. I am not engaged in rendering any legal or professional services by placing these general informational materials on this website.
I specifically disclaim any liability, whether based in contract, tort, strict liability or otherwise, for any direct, indirect, incidental, consequential, or special damages arising out of or in any way connected with access to or use of the site, even if I have been advised of the possibility of such damages, including liability in connection with mistakes or omissions in, or delays in transmission of, information to or from the user, interruptions in telecommunications connections to the site or viruses.
I make no representations or warranties about the accuracy or completeness of the information contained on this website. Any links provided to other server sites are offered as a matter of convenience and in no way are meant to imply that I endorse, sponsor, promote or am affiliated with the owners of or participants in those sites, or endorse any information contained on those sites, unless expressly stated.


No comments:
Post a Comment