| Tweet | Follow @OphirGottlieb |  |  |
The Power of Visual Data; Beyond Exceptional

This visualization is provided by: Capital Market Laboratories (join the queue: free trial)
FB - There is No Other Mega Cap Like it; Astonishing Visualizations
BABA - Silence the Noise; Introduction to Facts & Glaring Questions (5 Charts)
TWTR - A Whirlwind of Contradictions & Two-tailed Risk (8 Charts)
TSLA - 10 Charts That Will Challenge Your Conviction

Conclusion
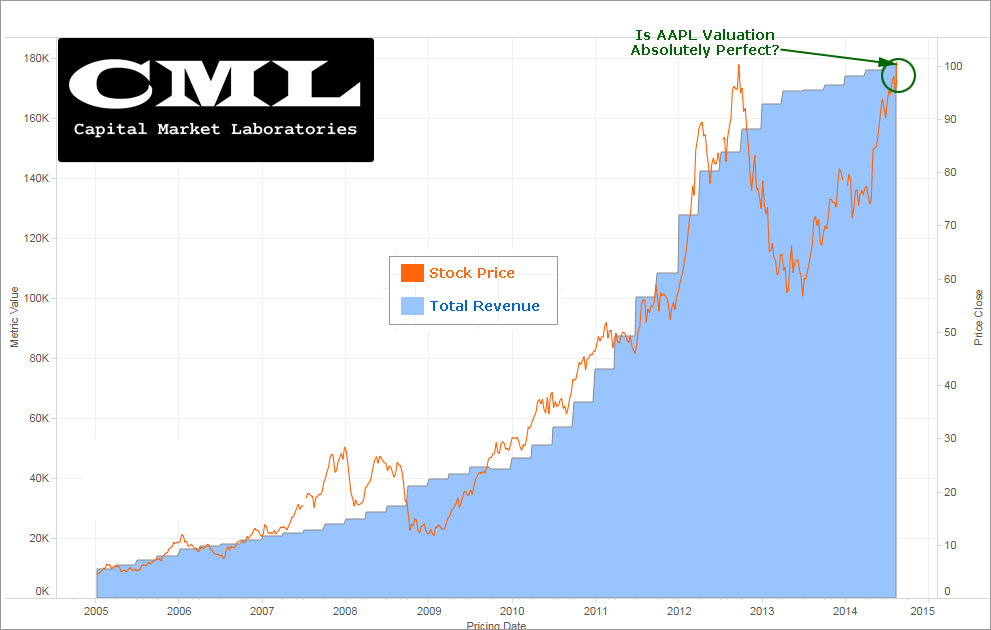
There's one chart, as simple as it comes, of AAPL total revenue (TTM) to its stock price over the last 10-years from which make we could make an argument that not only have we found a perfect valuation methodology for AAPL, but that AAPL is priced perfectly, right now.

AAPL stock price tracks total revenue (TTM) remarkably closely. When the stock price gets out of whack (above or below) relative to the revenue chart, it has always come back to equilibrium. Right now the two charts are literally on top of each other.
________________________________
Details on Trailing Twelve Months (TTM):
Last 4 Quarters of AAPL revenue in thousands:
37432000, 45646000, 57594000, 37472000.
Sum = 178144000
________________________________
What if we could look at 25,000 public companies in every region of the world (including frontier and emerging markets) and every financial, earnings & growth measure against stock price, against a custom peer group, in a time series or point-in-time, with charts that have 'living animated data' that moves, breathes, deletes and appears at your command?
We can... and now we do.

Join the Revolution
#CapitalMarketLabs
The Power of Visual Data is Beyond Exceptional
This is not a recommendation.
Follow @OphirGottlieb
Tweet
Legal Stuff:
Options involve risk. Prior to buying or selling an option, an investor must receive a copy of Characteristics and Risks of Standardized Options. Investors need a broker to trade options, and must meet suitability requirements.
The information contained on this site is provided for general informational purposes, as a convenience to the readers. The materials are not a substitute for obtaining professional advice from a qualified person, firm or corporation. Consult the appropriate professional advisor for more complete and current information. I am not engaged in rendering any legal or professional services by placing these general informational materials on this website.
I specifically disclaim any liability, whether based in contract, tort, strict liability or otherwise, for any direct, indirect, incidental, consequential, or special damages arising out of or in any way connected with access to or use of the site, even if I have been advised of the possibility of such damages, including liability in connection with mistakes or omissions in, or delays in transmission of, information to or from the user, interruptions in telecommunications connections to the site or viruses.
I make no representations or warranties about the accuracy or completeness of the information contained on this website. Any links provided to other server sites are offered as a matter of convenience and in no way are meant to imply that I endorse, sponsor, promote or am affiliated with the owners of or participants in those sites, or endorse any information contained on those sites, unless expressly stated.


Great chart and company! Is it a buy, sell or hold at this price! Thanks, Mike
ReplyDeleteI can't give advice, but chart seems to point to fair value.
DeleteWhat does the number 180K signify? I don't understand what Metric is being used. Latest revenue figure is $170.87 Billion.
ReplyDeleteLast 4 Quarters of AAPL revenue in thousands:
Delete37432000, 45646000, 57594000, 37472000. Sum = 178144000
The revenue numbers are Trailing Twelve Months (TTM)
It should really be revenue in millions. If the number were in thousands, it should have been 180m since 180 m*k = 180b is AAPL TTM revenue
Deleteyes, the chart is in millions.
Delete