| Tweet | Follow @OphirGottlieb |  |  |

PLUG is trading $5.51, down small with IV30™ up 0.8%. The Symbol Summary is included below.
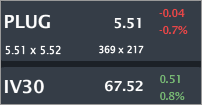
Provided by Livevol
I have no position in PLUG and am neither bullish nor bearish.
____________________
Update: 9-16-2014
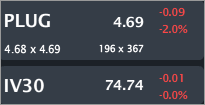
Provided by Livevol
PLUG is down 14% since the original post (August 29th, 2014)
____________________
Conclusion
The risk pricing in PLUG is a phenomenon we have never seen before and may never see again.
PLUG is not in equilibrium... It cannot exist here.. It will either boom to new levels of business (and likely stock) success, realizing the great promise that many see in it, or it will fail and go away.
I will demonstrate in depth financial measure analysis, likely deeper than you have ever seen before on this company using the power of visual data and also examine unprecedented option volatility and let you decide: Is the option market wrong about PLUG?
The three-year stock chart is included below.

Provided by Charles Schwab optionsXpress
Endpoint-to-endpoint, the stock is up 215%. But, it's rather obvious, this was not a straight line up. In just the last two years the stock has traded below $1 and above $10. But let me show you some financial measures that may
Revenue (TTM)
This chart may surprise you, it did me. While PLUG has hundred million dollar contracts to come (or so it appears), the company as if right now simply is not growing. It just isn't... on a trailing twelve months measure. Quarterly, it is. Last four quarters from most recent to least recent:
$17.3M, $5.6M, $8.0M, $4.6M

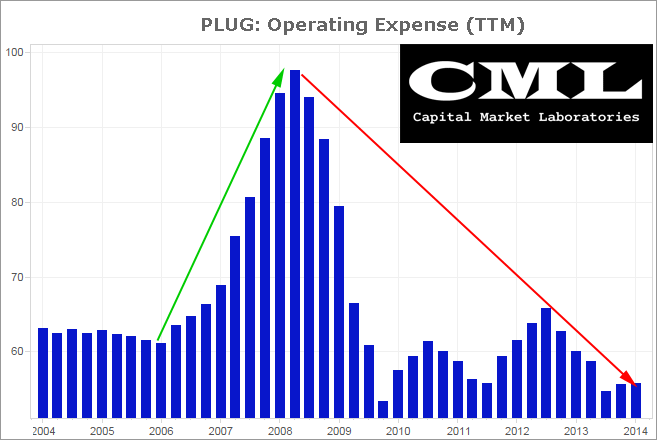
Operating Expense
This is a nice chart in that it shows how PLUG expenses were exploding for a while, but the firm has certainly managed to reign in that spending. We'll see later that a lot of that expense reduction may be coming from a place you wouldn't have expected... nor necessarily be overjoyed with. In any case, the OpEx explosion has been stemmed, and reduced rather nicely by management.
Gross Margin % (TTM)
This is an ugly one. The red indicates that gross profit is negative. That means, for now, every dollar of product PLUG sells costs more to make than it receives, even at the most basic level. This is not an issue with R&D, which would be an expense below this line. I do note that for the most quarter (not trailing twelve months) the gross margin % for PLUG was positive. It was small (1.1%), but positive...
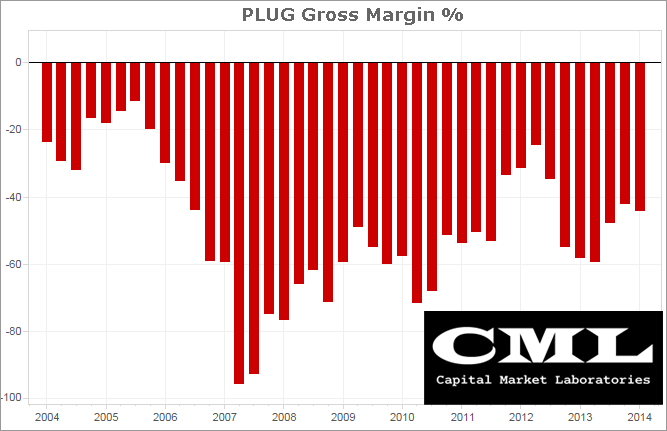
This could be an issue with R&D if that investment makes the cost of goods sold lower in the future and this certainly could be remedied if there are economies of scale to be had. i.e. make more product, cost per unit goes down. The economies of scale argument is a big on for PLUG, and may be quite valid.
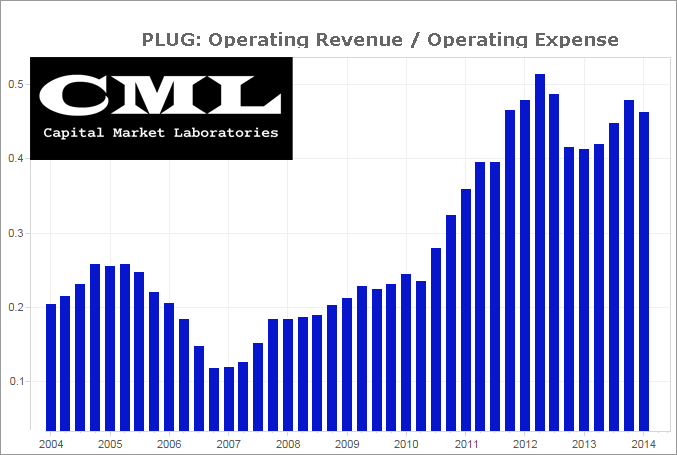
Operating Revenue / Operating Expense
This is one of my favorite measures. For a firm to a turn a profit, operating revenue-to-operating expense must be larger than 1.0. In this case, PLUG is at ~0.45, so it costs the firm ~$2.20 to generate $1 in revenue. That number is affected by R&D since research & development is an operating expense.
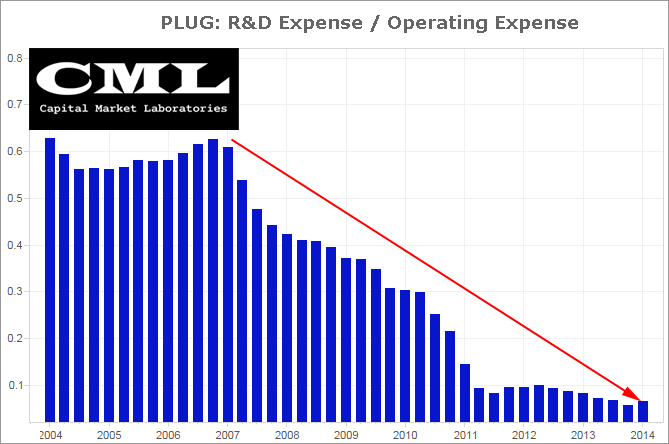
Speaking of Research & Development...
This can be seen as a glass half full or half empty... We can see the fact that the amount of money PLUG is spending (investing) in research & development has been plummeting relative to total operating expenses. Is that good because the research is done and the firm is ready to take it to market,or is it bad because the firm has stopped investing?
For the most recent quarter, PLUG did show a profit... we're talking about bottom line, net income. It was small... but it was positive.
In any case... there are essentially infinite other ways to look at this firm, but the point of all that (above) was simply to indicate that this firm is not in equilibrium... It cannot sit here.. It will either boom to new levels of business (and likely stock) success or it will fail and go away.
So that all means risk... But that is not what we see in the option market... at all.
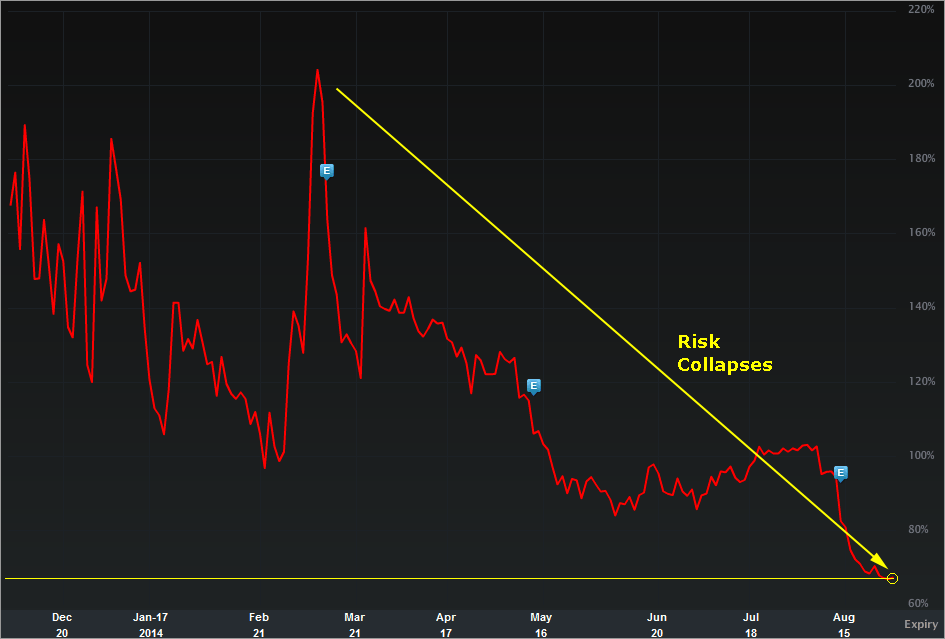
Let's turn to the IV30™ chart in isolation, below.
Provided by Livevol
The implied volatility is the forward looking risk in the equity price as reflected by the option market (IV30™ looks forward exactly 30 calendar days).
In English, the red curve is the risk in future stock price movement. We can see that the risk in PLUG has plummeted over the last year, and is sitting near all-time lows. I ask, bull or bear, how can that be?
Doesn't everyone agree the firm, good or bad, will not be in this position pretty soon? Now that chart I have above is the 30-day forward looking risk, which is awfully short-term.
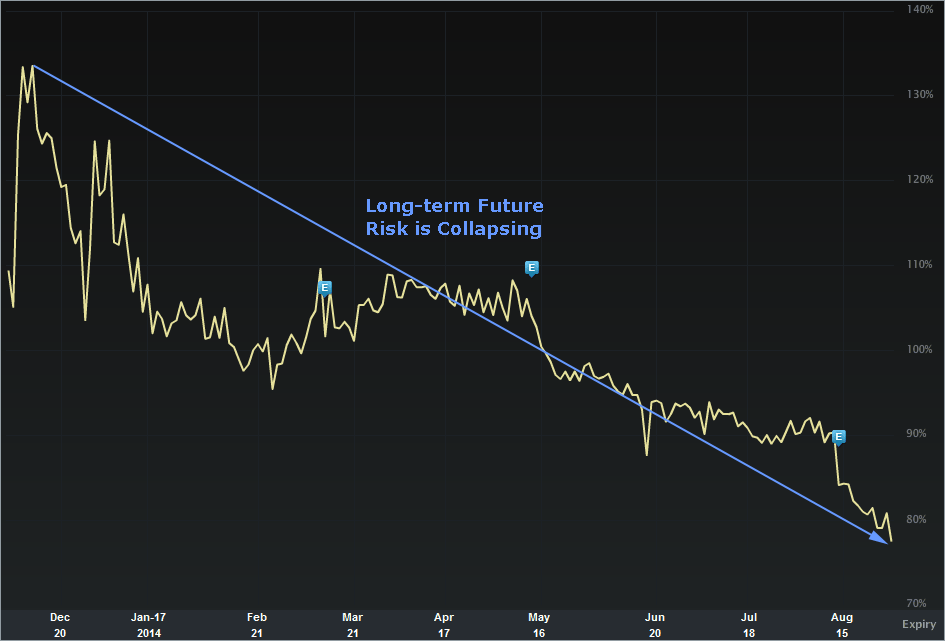
But then we also have this:
Provided by Livevol
Of everything I have seen in this post, this chart is the single most baffling of them all. That chart above is the IV360, or in English, the implied risk in the stock price over the next 360 calendar days (aka a year (ish)).
I just don't know what to say about this chart other than... wow... The forward looking risk over the next year in PLUG is at an all-time low. There you go...
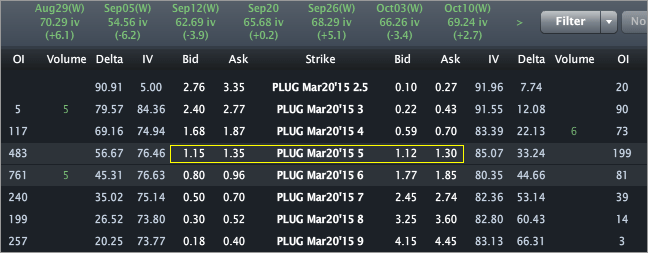
Finally, the Options Tab is included below (as of August 29th, 2014).
Provided by Livevol
I have included the March 2015 options, above.
Using the at-the-money (ATM) straddle we can see that the option market reflects a price range of [$2.50, $7.50] by the end of trading on March 19th, 2015.
- If you believe the stock will be outside that range on expiry or any date before then, then you think the volatility is too low.
- If you believe that range is too wide, and that the stock will definitively be in that range on expiration, then you think volatility is too high.
- If you're not sure, and can make an argument for either case, then you think volatility is priced just about right.
This is trade analysis, not a recommendation.
Follow @OphirGottlieb
Tweet
Legal Stuff:
Options involve risk. Prior to buying or selling an option, an investor must receive a copy of Characteristics and Risks of Standardized Options. Investors need a broker to trade options, and must meet suitability requirements.
The information contained on this site is provided for general informational purposes, as a convenience to the readers. The materials are not a substitute for obtaining professional advice from a qualified person, firm or corporation. Consult the appropriate professional advisor for more complete and current information. I am not engaged in rendering any legal or professional services by placing these general informational materials on this website.
I specifically disclaim any liability, whether based in contract, tort, strict liability or otherwise, for any direct, indirect, incidental, consequential, or special damages arising out of or in any way connected with access to or use of the site, even if I have been advised of the possibility of such damages, including liability in connection with mistakes or omissions in, or delays in transmission of, information to or from the user, interruptions in telecommunications connections to the site or viruses.
I make no representations or warranties about the accuracy or completeness of the information contained on this website. Any links provided to other server sites are offered as a matter of convenience and in no way are meant to imply that I endorse, sponsor, promote or am affiliated with the owners of or participants in those sites, or endorse any information contained on those sites, unless expressly stated.


Actually that the kind of site we want to read bookmark it for more updates
ReplyDelete