| Tweet | Follow @OphirGottlieb |  |
DDD is trading $53.55, up 1.7% with IV30™ up 5.0%. The Symbol Summary is included below.

Provided by Livevol
Conclusion
While the company has risk both with respect to execution and competition and the stock has been falling, now... risk is at an all-time low. Now that is something...
This is a stock and volatility note in a company that has remarkable trends evolving in the underlying financials. We will look at those trends along with the option market and come to a conclusion that may imply there is more risk in this stock than the option market reflects.
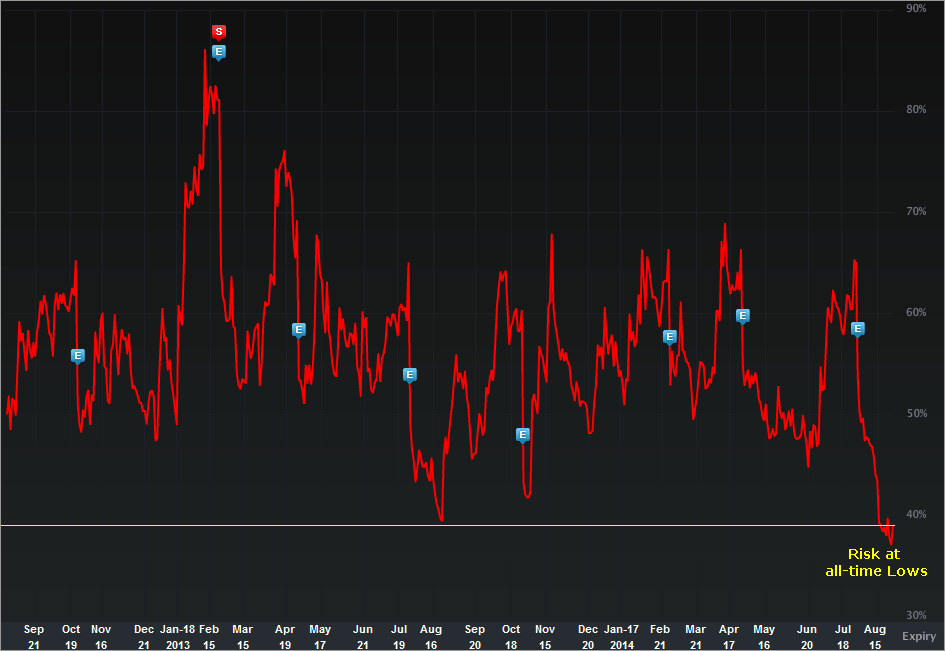
Before we turn to the financials, let's turn to the IV30™ chart in isolation (the 'risk').
Provided by Livevol
The implied volatility is the forward looking risk in the stock price as reflected by the option market (IV30™ looks forward exactly 30 calendar days).
In English, the red curve is the risk of future stock price movement. We can see that the risk in DDD is near all-time lows. So, the option market reflects lower risk in the stock price in the next 30 calendar days than ever before.
That's odd in-and-of-itself, but when we dig into the financials... it goes from weird, to questionable.

Let's start with the driver of everything with respect to financials, the revenue growth in DDD.
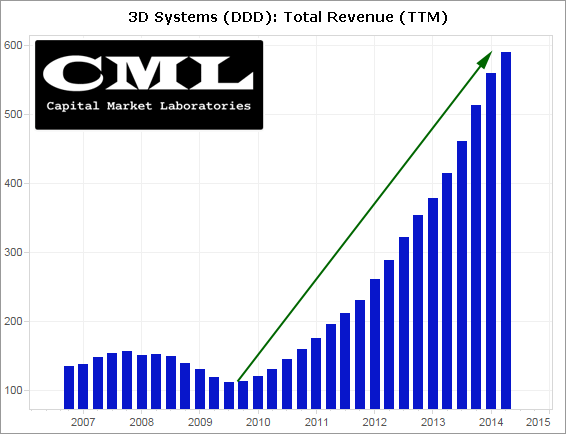
Now that's a chart... The interest and curiosity in 3D printing stocks has gone well beyond 'interest' and 'curiosity', and moved into massive (realized) revenue growth.
Now there are a lot of firms out there with raging revenue, the question is, does that revenue growth drive value? Here's a chart of DDD's book value in a time series.
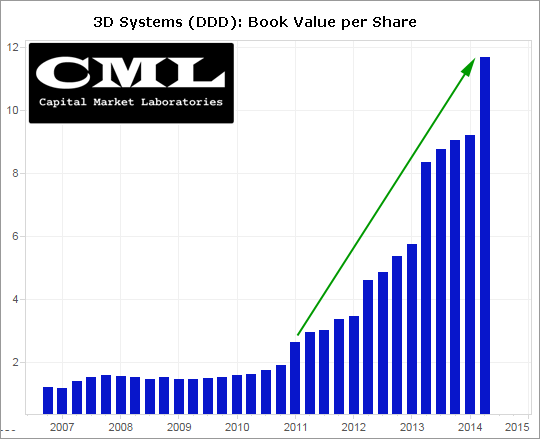
No, that's not the same chart... Note that DDD book value is ~$12 while the stock is trading in the $50's, but, we can clearly see that the revenue growth is causing (I'm claiming causality) enterprise value growth. The book value was below $1 a few years ago.
So those two charts show unfettered upward growth... i.e. up. But the stock price does not...
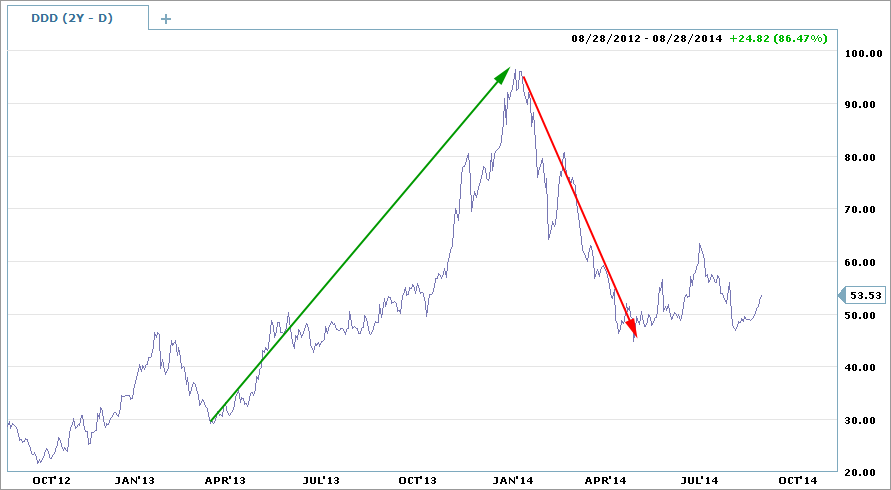
The two-year stock chart is included below.
Provided by Charles Schwab optionsXpress
Endpoint-to-endpoint, the stock is up 86%, but this path looks nothing like the first two financial measure charts we looked at. DDD exploded from ~$25 all the way up to ~$95 (~275% rise) and since then has fallen all the way back to the low $50s. The price made its way up back to ~$63, but ultimately came right back down to where we are now ($53).
So what's going on?... and, by the way, doesn't that imply risk?...
Now it's time for two more financial measure charts. The first is the gross margin % for DDD.
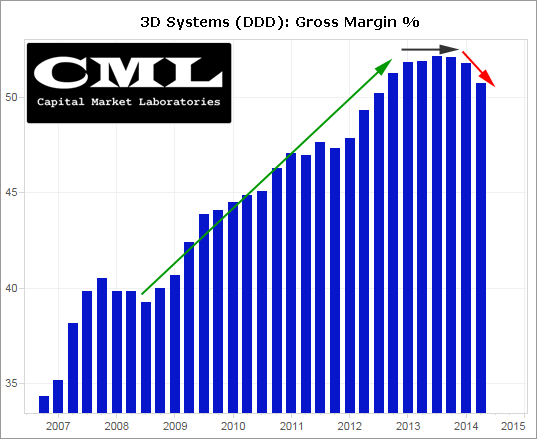
We can see an incredible ramp up from ~30% to over 50% as revenue was exploding. That's a great combination and that's why book value has been ripping. But...
Check out the last three quarters. Those bars are getting lower. In fact, for the last six quarters, the gross margin % has been stagnant. Now, before we scream bloody murder, mature companies hit a level in gross margin % and stay there and that's fine. This isn't necessarily bad news, but it is the end (for now) of unbelievable news -- and the stock price shows it.
Finally, we can look at the end result of all these financial measures, and that is simply the earnings from continuing operations margin %.
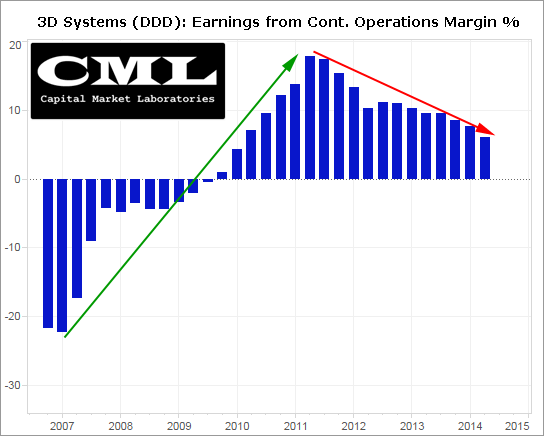
The rise was epic, from -25% to +18%. That's the result of growing gross profits and growing revenue. But, again, the last several quarters have seen a decline (though still positive). Again, the unbelievable news is over (for now) and thus the unbelievable stock rise is too.
DDD is also trying to grow through acquisition which can throw some of these financial measures sideways but may also point to... well, what we saw in the gross margin % chart - a peak.
Sometimes growing through acquisition is great, but often times, it is not. In fact, a univariate analysis (Somers' D) of companies in North America from 2002 through today shows a statistically significant relationship between frequent acquisitions and black swan stock drops. Look up my name in the Rotman International Research Journal where my findings were published, for details.
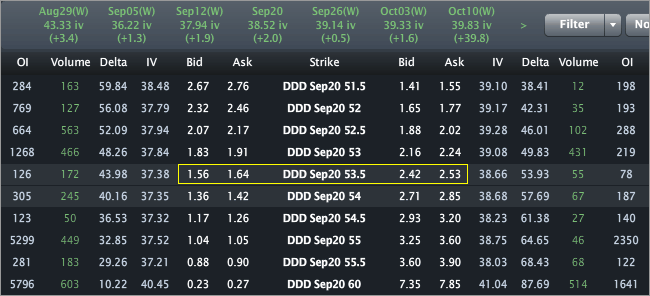
Finally, the Options Tab is included below. This is where we can see the explicit implications of that first chart I showed you -- the 'risk' as reflected by the option market.
Provided by Livevol
Using the at-the-money (ATM) straddle we can see that the option market reflects a price range of [$49.50, $57.50] by the end of trading on Sep 19th.
- If you believe the stock will be outside that range on expiry or any date before then, then you think the volatility is too low.
- If you believe that range is too wide, and that the stock will definitively be in that range on expiration, then you think volatility is too high.
- If you're not sure, and can make an argument for either case, then you think volatility is priced just about right.
This is trade analysis, not a recommendation.
Follow @OphirGottlieb
Tweet
Legal Stuff:
Options involve risk. Prior to buying or selling an option, an investor must receive a copy of Characteristics and Risks of Standardized Options. Investors need a broker to trade options, and must meet suitability requirements.
The information contained on this site is provided for general informational purposes, as a convenience to the readers. The materials are not a substitute for obtaining professional advice from a qualified person, firm or corporation. Consult the appropriate professional advisor for more complete and current information. I am not engaged in rendering any legal or professional services by placing these general informational materials on this website.
I specifically disclaim any liability, whether based in contract, tort, strict liability or otherwise, for any direct, indirect, incidental, consequential, or special damages arising out of or in any way connected with access to or use of the site, even if I have been advised of the possibility of such damages, including liability in connection with mistakes or omissions in, or delays in transmission of, information to or from the user, interruptions in telecommunications connections to the site or viruses.
I make no representations or warranties about the accuracy or completeness of the information contained on this website. Any links provided to other server sites are offered as a matter of convenience and in no way are meant to imply that I endorse, sponsor, promote or am affiliated with the owners of or participants in those sites, or endorse any information contained on those sites, unless expressly stated.


No comments:
Post a Comment