| Tweet |  |  |

This visualization is provided by: Capital Market Laboratories
Get an update when CML Light becomes available to the pubic
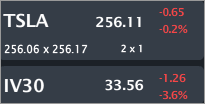
TSLA is trading $256.11, down small with IV30™ down 3.6%. The Symbol Summary is included below.
Provided by Livevol
TSLA stock is up 1,068% in three-years and its market cap rivals that of other auto manufacturers yet it's revenue is ~5% the size and the firm has never produced a profit. But the stock market isn't crazy.
Bull or Bear: You may simply be wrong about your conviction.
We're going to take look at over 1 billion rows of data, history and peers and find conclusions and answers within 10 seconds of looking at each section. That is the power of visualized data.
- We will see growth numbers that are unfathomably high relative to peers.
- We will see expense and earning quality measures that are unfathomably low relative to peers.
And then we will sit back and wonder, what the present value of all future free cash flows of this firm (because that's what a stock price is), and conclude:
Tesla Sits on an Island All By Itself.
Let's start with this table... which is truly... unfathomable.

So GM sold 120x more cars than TSLA in 2013 with 75x sales (revenue). At the same time, TSLA is worth ~60% of GM in market cap. Now let me show you why...
Conclusion
When compared to a relevant peer group (if one exists), TSLA is either the best or the worst in so many financial statement and growth measures that's it's almost a cartoon.
This article will serve as a deep deep dive into TSLA and its peers, and it may leave you grasping for a life jacket by the end. The data we are going to explore together, right now, is... incredible.
Recent News
How Tesla Is Changing the Electric Auto Industry Again
How Tesla Stretches Earnings Quality
------------ ANALYSIS ------------
I. Custom Peer Group
With over 26,000 pubic companies to start with, defining a peer group for TSLA is nearly impossible, it's the youngest and smallest (by revenue, net income, total assets and vehicles sold) car manufacturer in the world, yet it's also the fastest growing by revenue, gross profits, total assets and tangible book value.
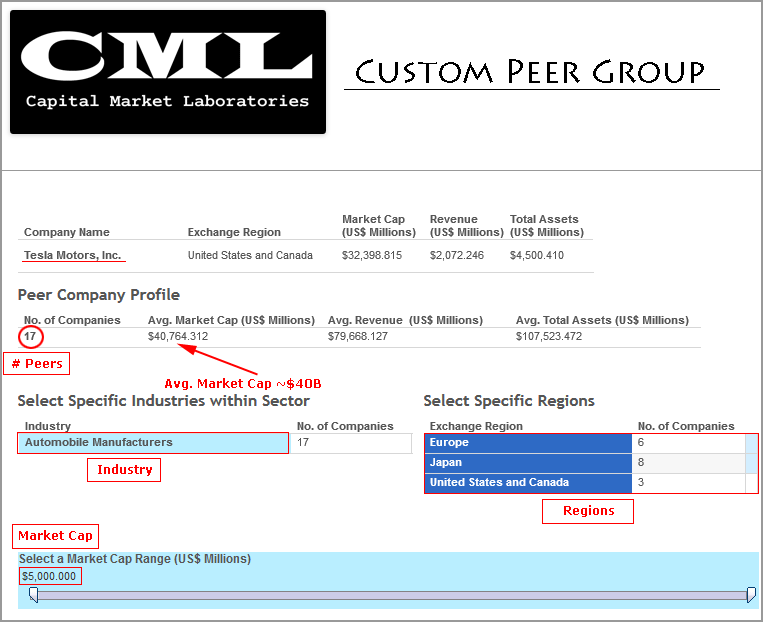
Custom Peer Group Steps
- Regions: Japan, Europe & North America only
- Industry: Automobile Manufacturer only
- Market Cap Minimum: $5 Billion
- 26,000 companies --> 17 companies

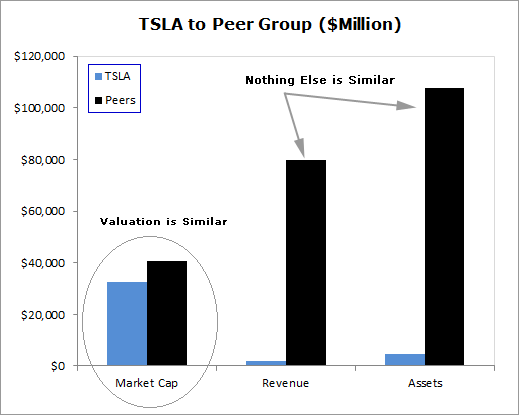
Now that we have a custom peer list, we can start comparing TSLA to it.
II. Financial Statement Comparisons
While there are millions rows of data for TSLA and its peers, it only takes us ~10 seconds to figure out where we should be looking:
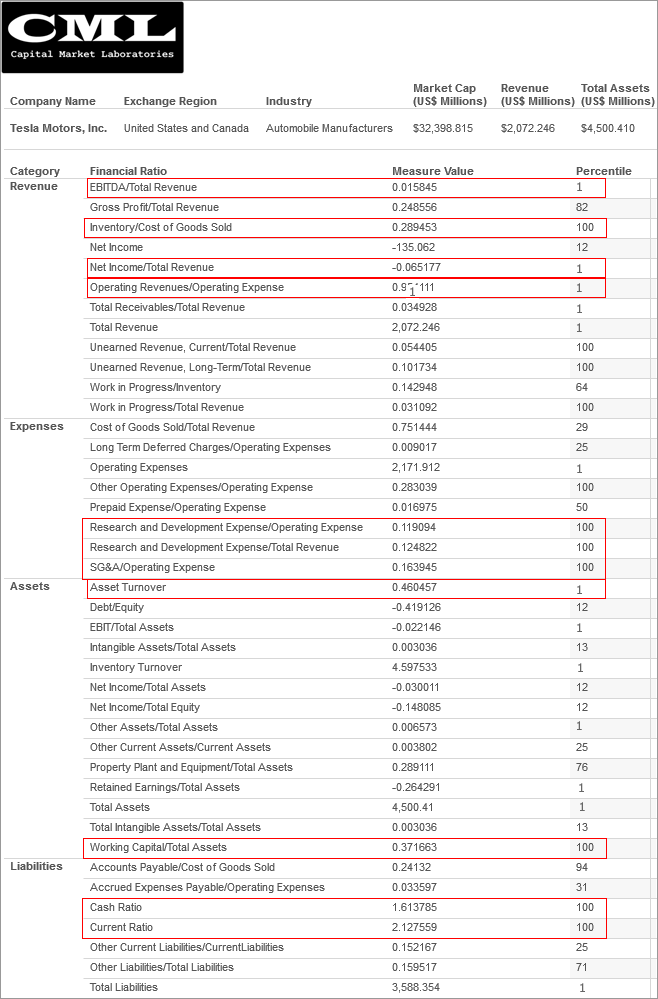
The percentiling (comparison) are relevant to just this custom peer group. While we normally a see a firm have one or two outlier measures relative to its peers, for TSLA, essentially everything it reports on the financial statement is unusual relative to peers... and by unusual I mean the highest or the lowest of all peers.
Let's check it out.
TSLA looks the 'worst' relative to several earnings measures, operating margins, asset and inventory turns, inventory to cost of goods sold (COGS), selling, general & admin expenses (SG&A) and, of course, total revenue.
TSLA is investing more than any other firm on a relative basis to R&D, and has the best liquidity ratios (cash and current ratio) of all peers.
That's a mouthful... now let's do the same thing for more earnings & growth measures as well.
III. Earnings & Growth Comparisons
Again, while there is nearly endless data for TSLA alone (not to mention its peers), it only takes us ~10 seconds to figure out where we should be looking:
Again, percentiling is relevant to just this custom peer group. And again, while we normally a see a firm have one or two outlier measures relative to its peers, for TSLA, essentially everything with respect to earnings and growth is either the highest or the lowest of all peers.
Let's check it out:
TSLA has the greatest growth in essentially every earnings measure that exists: Gross Profits, Tangible Book, Total Assets and of course, Total Revenue. Further, we see the growth is the highest for both one- and two-year periods.
At the same time, TSLA shows the worst Earnings from Continuing Operations Margin % and Net Income Margin %.
Honestly, how do you value a firm with these phenomena?
IV. Visualizations
* Revenue
Total Revenue (worst)
This visualization was actually included above. TSLA has ~ $2.3B in revenue, the peer group averages ~$80B. So what?
There better be some data, somewhere, somehow, to justify a valuation of over $30B.
Total Revenue, 1-year Growth % (best)
We can see below that TSLA is showing revenue growth (one-year) so large that it barely fits on the same chart as the rest of the peers.
The top horizontal chart shows us the distribution clearly, the scatter plot shows us the actual names.
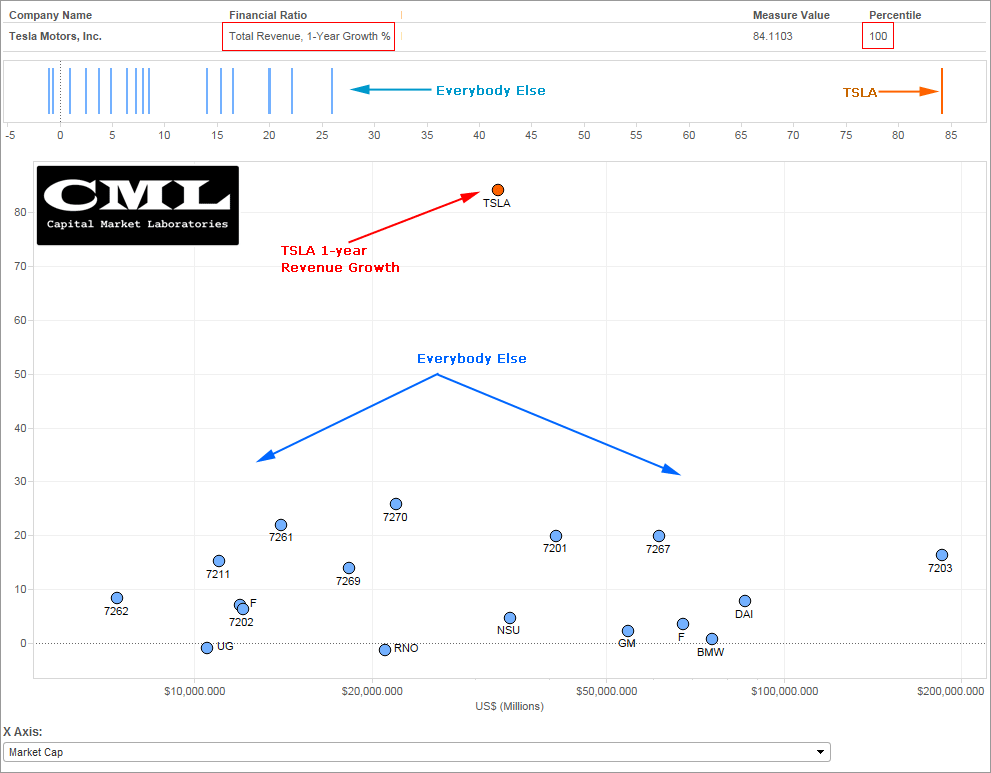
I will repeat this phrase a dozen times (or whatever), but: There's TSLA and then there's 'everybody' else when it comes to revenue growth.
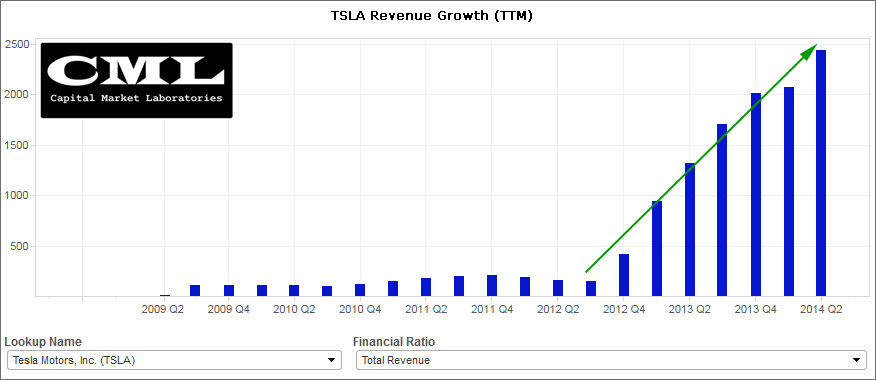
Revenue Growth (Time Series)
Just to look at it explicitly, here is the time-series of revenue (TTM) for TSLA by quarter.
Operating Revenue / Operating Expenses (worst)
At some point, for a company to turn a profit, Revenue:Expenses must be greater than 1. As of right now TSLA sits at 0.95. The horizontal chart illustrates where TSLA sits relative to the peer group. It is in the 1st percentile, aka, it's the lowest.

A scatter plot of the horizontal chart above helps illustrate this measure as well.
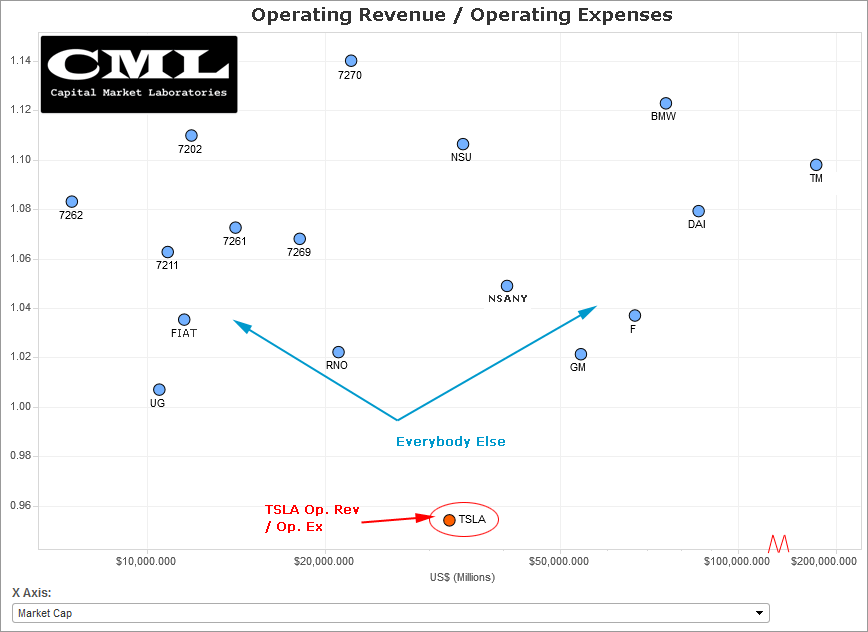
There's TSLA all by it's lonesome at the bottom. This measure removes any size issues -- it doesn't matter that TSLA has $2B in sales vs the average of $80B, this is simply a measure of operating efficiency.
There's TSLA and then there's 'everybody' else when it comes to operating efficiency.
* Expenses
Research & Development / Operating Expenses (highest)
TSLA is investing (expensing) more in Research & Development than any other peer. We can see that the firm is in the '100'th percentile, we can see the distribution in the horizontal chart and of course, we can see the actual scatter below that.
Something to note here, a number of the peers in this group aren't even on the chart... there is no R&D going on. While TSLA shows the largest R&D 'expense,' I would say this is a good sign, otherwise, what are we looking at? It would be a firm that is simply hemorrhaging earnings with no future. That is NOT the case with TSLA.

There's TSLA and then there's 'everybody' else when it comes to R&D.
Selling, General & Administrative Expense / Operating Expense (highest)
While very high R&D costs are acceptable (if not desirable) for TSLA, the SG&A expenses at the 100th percentile is not 'automatically' 'good' news. This is one of the few measures where TSLA and 'the rest' all fit on the same chart... TSLA is just spending more on these expenses relative to total operating expenses.
Higher SG&A for a newer firm is expected, but at the very least this isn't a 'good' sign.
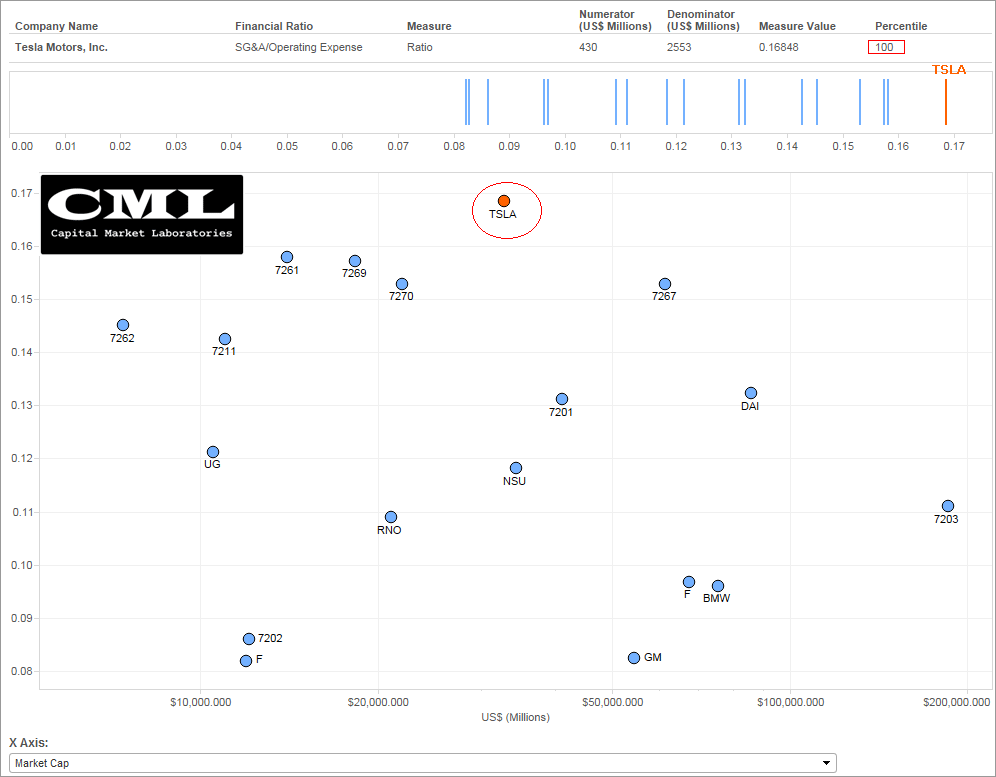
But when we look at the time series of SG&A / Operating Expense, we do see a very good sign... specifically, the huge spend is over (it appears), and the firm is now able to reign in these expenses while maintaining its goal of creating brand.
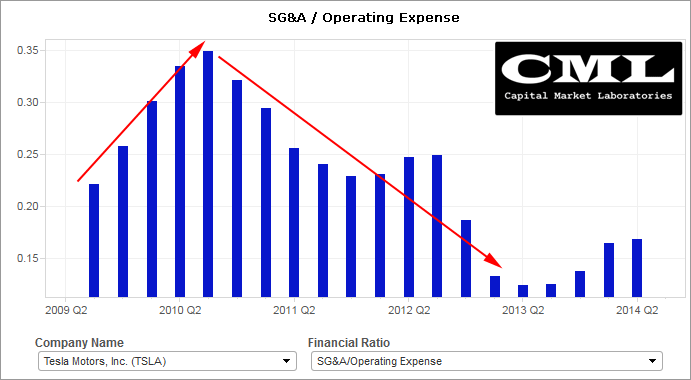
This time series alleviates some of the concern surrounding SG&A expense for TSLA relative to its peers.
* Liquidity
Current Ratio (highest)
Whatever your take on TSLA, there's really no risk at all of insolvency. In fact, we can look at the current ratio, which is (current assets) / (current liabilities) and see that TSLA is not only doing 'well,' it's actually doing better than every other peer (100th percentile).
The current ratio is an indication of a firm's market liquidity and ability to meet creditor's demands. Acceptable current ratios vary from industry to industry and are generally between 1.5 and 3 for healthy businesses. If a company's current ratio is in this range, then it generally indicates good short-term financial strength. - Wikipedia
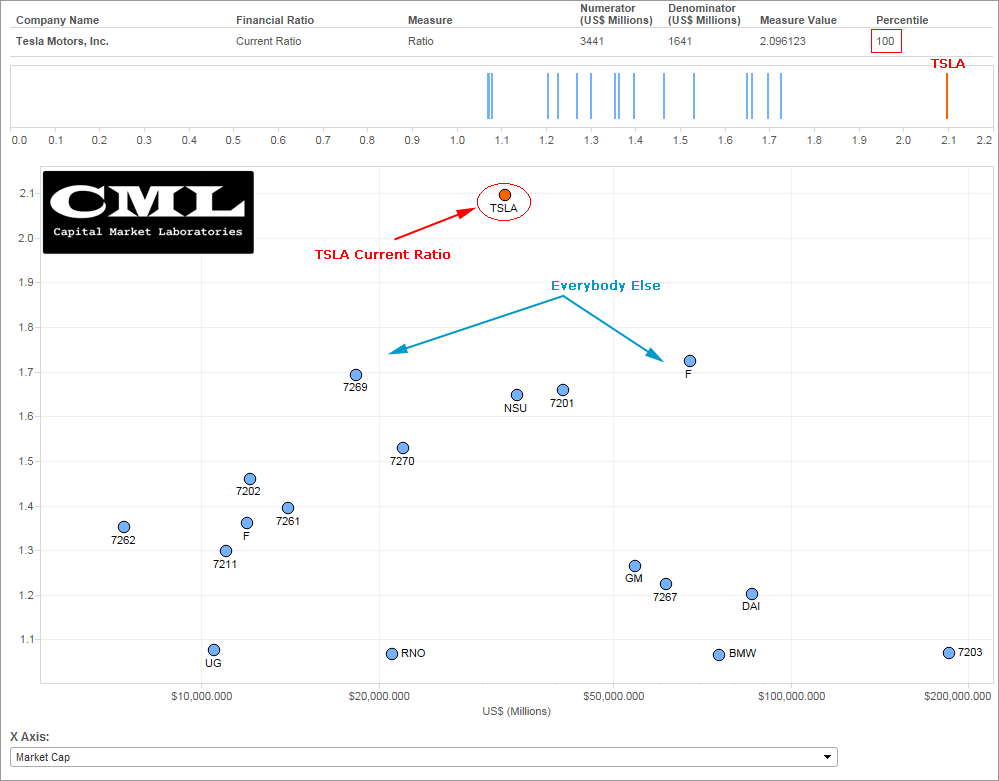
There's TSLA and then there's 'everybody' else when it comes to the current ratio.
* Earnings
Gross Profit, 1-year Growth % (highest)
When we start getting to the growth numbers relative to peers, we really do get into 'cartoonish' plots. This must be the case for there to be any justification for TSLA's valuation.
The difference in gross profit growth between TSLA and its peers is basically incomparable.
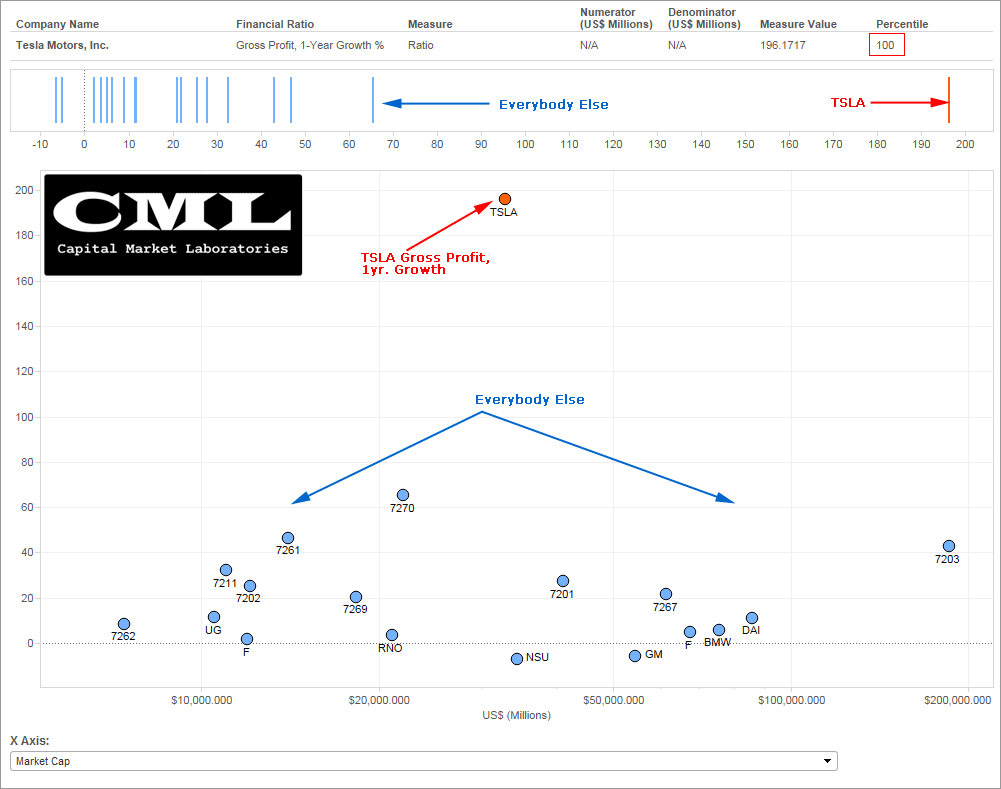
There's TSLA and then there's 'everybody' else when it comes to 1-year growth in gross profits.
.
Total Assets, 1-year Growth %
One of the most remarkable growth measures for TSLA is total assets. I've actually had to collapse that horizontal axis to make this fit on one-page -- that's how fast TSLA is growing its assets relative to peers.

Again, a scatter plot helps us see the comparison with some names attached to the peers.
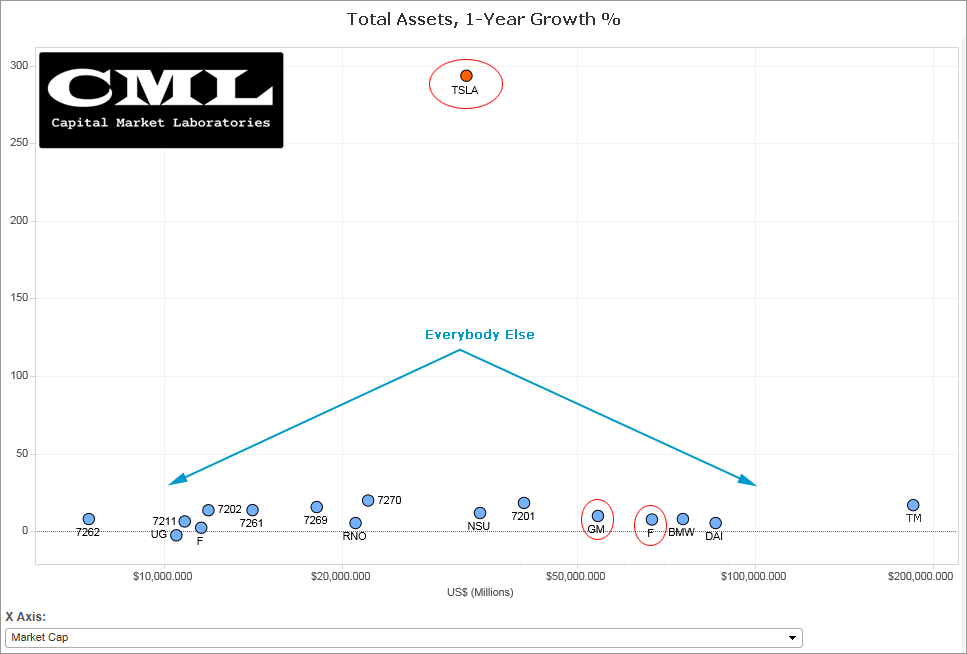
I've circled TSLA as well as GM and F. In reality, it doesn't matter what I circle, this is a 'cartoon' chart: there is nothing like TSLA in the automobile manufacturing business when it comes to growth measures and assets is one of the largest.
There's TSLA and then there's 'everybody' else when it comes to asset growth.
Summary & Conclusion
We have taken an exhausting look at TSLA relative to a custom peer group, and whether the custom peer group is what you would have chosen, what we really see is that it doesn't matter what the peer group is, TSLA sits on an island all by itself.
Its valuation and industry is quite similar to its peers, but nothing else is.
- It's earnings growth measures are exploding to such a point that we can barely fit TSLA on a chart with its peers.
- Its financial statement measures (the quality of earnings) are atrocious.
So...
Can we can justify its valuation through explosive and incomparable growth rates in revenue, assets and tangible book?
Is the valuation unjustifiable given its current level of earnings quality (which is awful)?
- Is this the right question: Is TSLA really worth 2/3 of GM?
- Or is this the right question: Is GM really worth 1.5x TSLA?
The 'argument' will play out in the stock market. But now you know... TSLA is unlike any other company. Comparisons?... To which companies? On which measures? For what time-period? I have no idea.
But if you're a bull (or a bear) and have an undying devotion to your position, you may be wrong. Not that the stock will go up or down. You simply may be wrong about your conviction. How can you have conviction with the data we just saw?
I do know that the firm is now worth $33B per the equity market. That is a fact... today.
This is trade analysis, not a recommendation.
Follow @OphirGottlieb
Tweet
Legal Stuff:
Options involve risk. Prior to buying or selling an option, an investor must receive a copy of Characteristics and Risks of Standardized Options. Investors need a broker to trade options, and must meet suitability requirements.
The information contained on this site is provided for general informational purposes, as a convenience to the readers. The materials are not a substitute for obtaining professional advice from a qualified person, firm or corporation. Consult the appropriate professional advisor for more complete and current information. I am not engaged in rendering any legal or professional services by placing these general informational materials on this website.
I specifically disclaim any liability, whether based in contract, tort, strict liability or otherwise, for any direct, indirect, incidental, consequential, or special damages arising out of or in any way connected with access to or use of the site, even if I have been advised of the possibility of such damages, including liability in connection with mistakes or omissions in, or delays in transmission of, information to or from the user, interruptions in telecommunications connections to the site or viruses.
I make no representations or warranties about the accuracy or completeness of the information contained on this website. Any links provided to other server sites are offered as a matter of convenience and in no way are meant to imply that I endorse, sponsor, promote or am affiliated with the owners of or participants in those sites, or endorse any information contained on those sites, unless expressly stated.


The results in your study seem to depend on the definition of the peer group. Can you please name elements in peer group? It seems to be a bit short sighted to compare very different elements (young start up company and established companies). Would have been very interesting to see results of a comparison with other new tech companies / start up companies. Thanks for your good work!
ReplyDeleteAs a percentage the growth is huge. As a dollar amount it is not. Tesla is priced to perfection for 2024 with the assumptions being: ICE has no life left, nobody can compete with Tesla tech, another tech won't obsolete lithium battery power, the masses will accept EV, gasoline won't get cheaper, there is actually a price point with a positive margin that sells, the gigafactory materializes, Elon remains healthy and focused, etc..
ReplyDeleteAgreed. The risk of competition is enormous as well as technical obsolescence. Market us wildly underpricing risk.
Delete