| Tweet |  |  |
Summary of Momentum
All major indices were up for the third consecutive week after the momentum implosion four weeks ago. Check out the index movements week-to-week for the last four weeks.

Data by Yahoo! Finance
It could get bumpy for the last week of August & earnings are a part of the risk.
What Could Move Markets this Week
This Week: Article Soon * GDP Q2 "Revision" * Consumer Sentiment * Consumer Earnings * Momentum Whiplash #KnowEverything
— Ophir Gottlieb (@OphirGottlieb) August 24, 2014- The first Q2 GDP Revision
- Consumer Stock Earnings (list below)
- Momentum Cyclical Pattern May Signal Reversal
Last Week: Must Know
All Stock Indices: Up for the third week in a row.

Data provided, Yahoo! Finance, Charles Schwab optionsXpress
The momentum "issue"went from a collapse, to mixed, to now markedly bullish (right?).
* As of Friday: 69% of stocks are now trading above their 20-day MA
* As of 4-weeks ago: 34% of stocks were trading above their 20-day MA
We'll get to the rest of momentum a bit later, but one odd thing to note: The violent change in momentum from bearish to bullish might actually be a sign of... another drop?
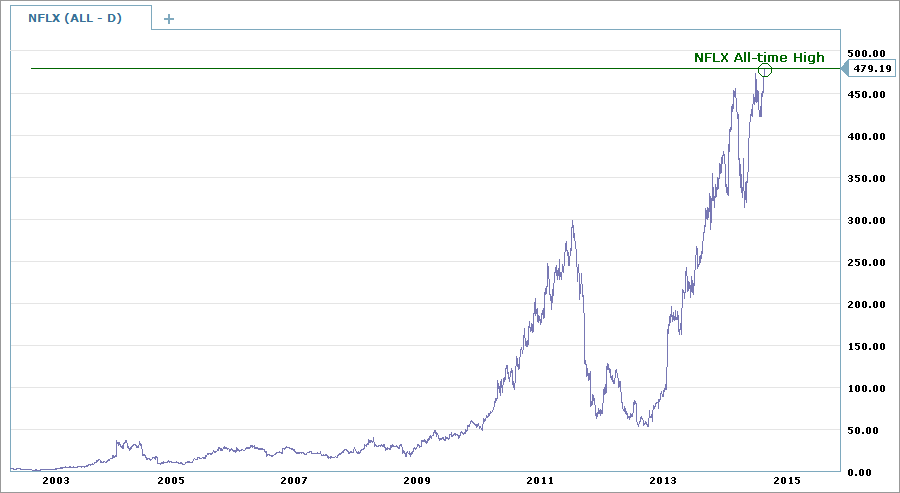
Chart of the Week: #MOMO Poster Child NFLX Hits an All-time High
Chart of the Day: * $NFLX All-time High * +11,300% Since IPO http://t.co/JHsizYpfgB - What's Next: $400 or $500? pic.twitter.com/tyv7ru34Bz
— Ophir Gottlieb (@OphirGottlieb) August 22, 2014
Provided by Charles Schwab optionsXpress
Last Week: Phenomena We Must Know
8-21-2014
* Twitter (TWTR) - Unprecedented: Risk Breaks All-time Lows; Stock Moves in Huge Cycles.
8-20-2014
* Tesla (TSLA) - A Depth of Analysis Like Never Before & 10 Charts That Will Blow Your Mind
8-19-2014
* Apple (AAPL) - All-time High & 3 Huge Risk Profile Changes Mean: Completion of a New Identity
8-18-2014
* Tekmira (TKMR) - Ebola, Hepatitis B... Option Market: No Idea What Stock is Worth
Last Week: Stats Must Know
Momentum collapsed three weeks ago, and has recovered so violently it might actually be a bearish sign.

Provided by BarChart.com
Compare the numbers from 'last week' to 'today.' Everything looks 'better.'
* As of Friday: 69% of stocks are now trading above their 20-day MA
* As of 4-weeks ago: 34% of stocks were trading above their 20-day MA
* As of Friday: 51% of stocks are now trading above their 50-day MA
* As of 4-weeks ago: 46% of stocks were trading above their 50-day MA
And the longer-term view (and most important in my mind):
* As of Friday: 56% of stocks are now trading above their 200-day MA
* As of 4-weeks ago: 54% of stocks were trading above their 200-day MA
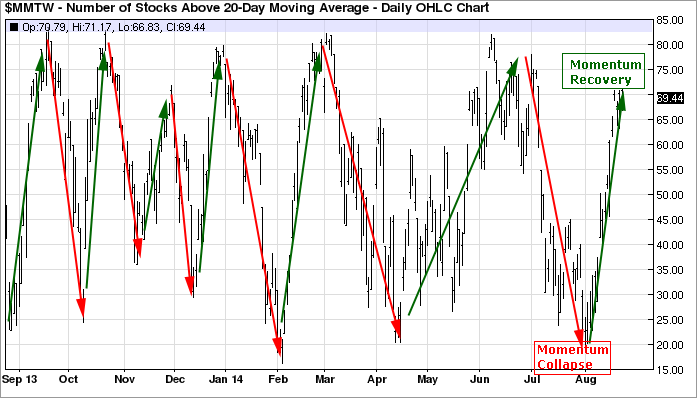
Here's a fascinating image that covers the percent of stocks above the 20-day moving average over the last year. Note how we are stuck in a cyclical peak/trough pattern... Perhaps the peak as of right now points to a change in direction, just as the trough 4-weeks ago pointed to a bullish swing.
Here's the 20-day MA.

Provided by BarChart.com
Last Week: Must Know Headlines:
* US housing recovery appears to be back on track
* Fed minutes: Some want 'relatively prompt' rate hike
* US Home Construction Jumps 15.7 Percent in July
* Why irrational exuberance does not explain this stock market
This Week: Must Know
This week there is a good deal of economic data and retail is still on the radar in terms of earnings.
Below you will find all that we need to prepare for the week to come. All data and images for this report are provided by Charles Schwab optionsXpress.
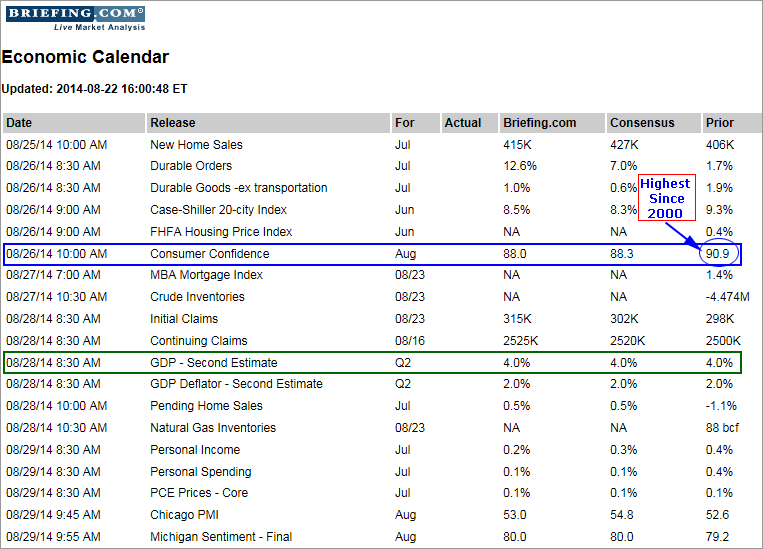
This Week: Economic Calendar
This week we can focus on the consumer, both with respect to economic data and earnings.
Last week's consumer sentiment was the highest since 2000. We'll get an update on Tuesday.
The second estimate for Q2 GDP is due out on Thursday. The initial reading was a rip roaring 4.0% all but erasing any memory of the Q1 shrinkage in GDP (the winter blues).

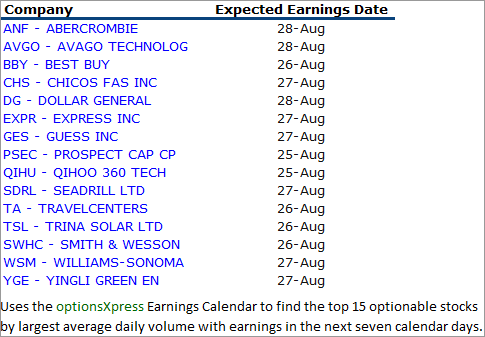
Partial List of Noteworthy Earnings This Week

Look how many consumer names report next week:
- ANF
- BBY
- DG
- EXPR
- GES
- WSM
Combine that with sentiment data and a new GDP estimate.. it could get bumpy for the last week of August.
This is trade analysis, not a recommendation.
Follow @OphirGottlieb
Tweet
Legal Stuff:
Options involve risk. Prior to buying or selling an option, an investor must receive a copy of Characteristics and Risks of Standardized Options. Investors need a broker to trade options, and must meet suitability requirements.
The information contained on this site is provided for general informational purposes, as a convenience to the readers. The materials are not a substitute for obtaining professional advice from a qualified person, firm or corporation. Consult the appropriate professional advisor for more complete and current information. I am not engaged in rendering any legal or professional services by placing these general informational materials on this website.
I specifically disclaim any liability, whether based in contract, tort, strict liability or otherwise, for any direct, indirect, incidental, consequential, or special damages arising out of or in any way connected with access to or use of the site, even if I have been advised of the possibility of such damages, including liability in connection with mistakes or omissions in, or delays in transmission of, information to or from the user, interruptions in telecommunications connections to the site or viruses.
I make no representations or warranties about the accuracy or completeness of the information contained on this website. Any links provided to other server sites are offered as a matter of convenience and in no way are meant to imply that I endorse, sponsor, promote or am affiliated with the owners of or participants in those sites, or endorse any information contained on those sites, unless expressly stated.


No comments:
Post a Comment