| Tweet |  |  |
This is a post dedicated to market internals, and even more myopically, market momentum. The drop in the market of late (and today in particular) is not a surprise for those that read this post from the weekend:
Preparation: Must Know for the Week to Come; Must Know from Last Week
I'm going to share three charts and one table (all from barchart.com). But none of it matters to me... except for one...
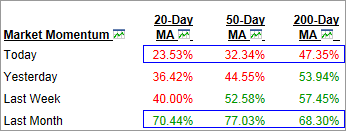
First, a summary:

Provided by BarChart
Essentially every measure of momentum with respect to daily moving averages (dma) was at or over 70% as of one-month ago. Look at that last line boxed in blue: 20dma, 50dma, 200dma.
And today, at the top of that chart, those numbers are all below 50%. Scary?... Well here's a chart:

Provided by BarChart
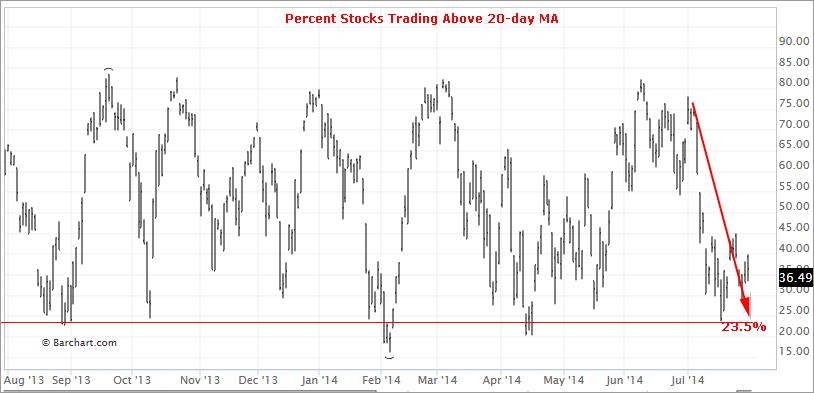
This chart puts in a picture the last year of the 20 day moving average.
- Today: 23% above 20-dma
- Last Month: 70% above 20-dma
- 52 wk Low: ~17%
The 20-dma is very volatile as we can see in the chart and in fact has been substantially lower in the last year while the market has gone up.
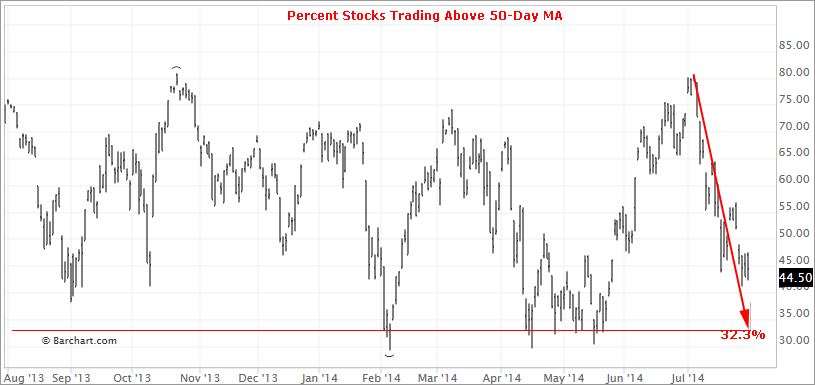
Now a chart of the 50-dma for the last year.

Provided by BarChart
- Today: 32% above 50-dma
- Last Month: 77% above 50-dma
- 52 wk Low: ~29%
The 50-dma is also volatile, although certainly not as much a the 20-dma. The 50-dma has also been lower in the last year.
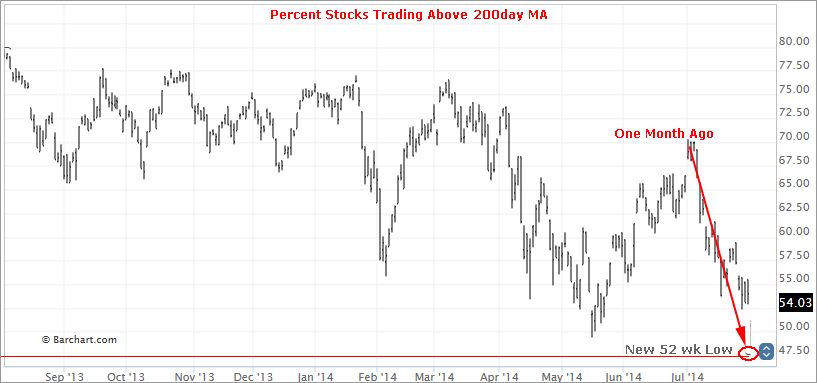
And finally, the 200-dma chart.

Provided by BarChart
- Today: 47% above 50-dma
- Last Month: 68% above 50-dma
- 52 wk Low: Right Now (prior was 52%)
Note how the 200-dma chart is much less volatile than the shorter time periods. Note also how the 200-dma is well into a new annual low.
This one matters to me b/c the annual low was still above 50%. 'Was'... But:
- This number hit 36% in Nov 2012
- This number hit 9% in Oct 2011
Does this 200-dma chart scare me?... No.
In fairness, very little scares me in the market other than huge up swings (how odd is that?).
Does this mean anything? I believe it does. This move down has been building for several weeks (see all three charts) and is on the back of:
- Economic Data
- Earnings Data
- Geopolitical Fears
This time... I believe it will not be the end of the world (hyperbole of course).
But last time I did... and I was dead wrong.
When will the bull end (in my opinion)? Watch. The. Rates.
This is trade analysis, not a recommendation.
Follow @OphirGottlieb
Tweet
Legal Stuff:
Options involve risk. Prior to buying or selling an option, an investor must receive a copy of Characteristics and Risks of Standardized Options. Investors need a broker to trade options, and must meet suitability requirements.
The information contained on this site is provided for general informational purposes, as a convenience to the readers. The materials are not a substitute for obtaining professional advice from a qualified person, firm or corporation. Consult the appropriate professional advisor for more complete and current information. I am not engaged in rendering any legal or professional services by placing these general informational materials on this website.
I specifically disclaim any liability, whether based in contract, tort, strict liability or otherwise, for any direct, indirect, incidental, consequential, or special damages arising out of or in any way connected with access to or use of the site, even if I have been advised of the possibility of such damages, including liability in connection with mistakes or omissions in, or delays in transmission of, information to or from the user, interruptions in telecommunications connections to the site or viruses.
I make no representations or warranties about the accuracy or completeness of the information contained on this website. Any links provided to other server sites are offered as a matter of convenience and in no way are meant to imply that I endorse, sponsor, promote or am affiliated with the owners of or participants in those sites, or endorse any information contained on those sites, unless expressly stated.


No comments:
Post a Comment