| Tweet |  |  |
Conclusion
It's the last week of the month in the swing of earnings season (full list below) and that means data, data, data... especially on the macro economic front. A huge week.
One huge trend continues... momentum is imploding and according to those numbers we are inches away from am official bear market (internals test).
We are in a different market from three-weeks ago as of... right now.
Last Week: Must Know
Last week we saw, yet again, the Russell 2000 lower as the S&P 500 rose (barely) and NASDAQ rose. I note that much of the DJIA drop was simply due to V (Visa).

Data provided, Yahoo! Finance, Charles Schwab optionsXpress
Momentum continues its shift to the bearish side. The Russell 2000 is just a symptom of an obvious market phenomenon. We'll take a look at some charts (below) to see the radical shift, but here are three simple stats:
* As of Friday: 34% of stocks are now trading above their 20-day MA
* As of three weeks ago: 76% of stocks were trading above their 20-day MA
* As of Friday: 47% of stocks are now trading above their 50-day MA
* As of three-weeks ago: 80% of stocks were trading above their 50-day MA
Last week the NASDAQ 100 hit a 52 wk high but with this time it has happened with fewest number of constituents (also) making new highs ever.
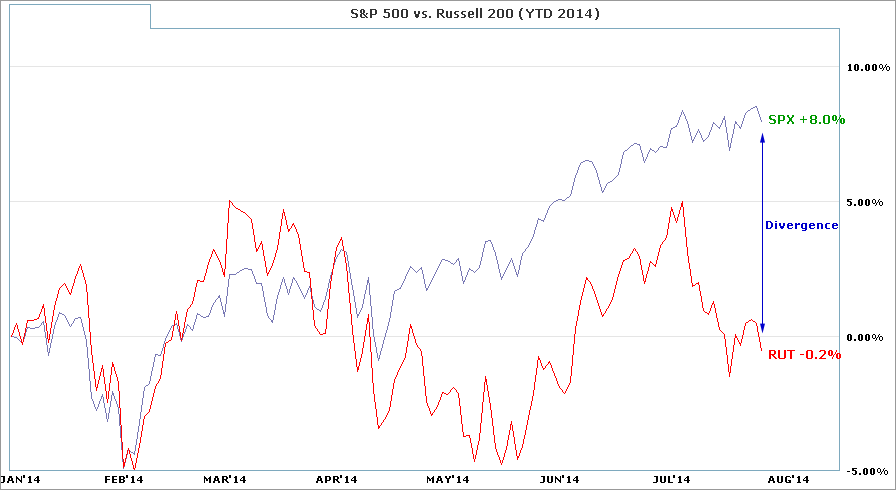
Chart of the Week: SPX and RUT Divergence

As small caps under-perform we must remember that there are 2000 companies in the Russell 2000 (aptly named) and just 500 companies in the S&P 500 (also aptly named). So what?...
The under-performance in the Russell 2000 is an under-performance of the majority of companies. Yes, both are market cap weighted, but that's an even bigger tilt to the side of fewer companies leading the market up. Tick, tock...
And that's not even the most interesting part of last week.
Last Week: Phenomena We Must Know
7-24-2014
* Amazon.com (AMZN) - Earnings Implosion, Never Before Seen Risk Malaise.
7-24-2014
* Facebook (FB) - Earnings Postmortem: Did You Get All of This? Why FB is Now Larger than IBM
7-22-2014
* Puma Biotechnology (PBYI) - Stock Explodes 220% After Hours on FDA Trial Results: Potential Cure for Breast Cancer
Last Week: Stats Must Know
Momentum has maintained what is now turning into a bear market signal.
* As of Friday: 47% of stocks are now trading above their 50-day MA
* As of three-weeks ago: 80% of stocks were trading above their 50-day MA
* As of five-weeks ago: 72% of stocks were trading above their 50-day MA

Provided by BarChart.com
But there's more... Check out the 20-day moving average numbers:
* As of Friday: 34% of stocks are now trading above their 20-day MA
* As of three weeks ago: 76% of stocks were trading above their 20-day MA
Again, we see that in the Russell 2000. We also saw the NASDAQ 100 hit a 52 wk high but with this time it has happened with fewest number of constituents making new 52 wk highs ever.
A little perspective: A one-year chart of the percentage of companies trading above their 50 day moving average.

Provided by BarChart.com
In three weeks we have gone from 80%+ to now 46.6%.
Last Week: Must Know Headlines:
* Unbelievable collapse in small-cap stocks
* Facebook results soar on mobile-advertising growth
* Why the economy may be worse off than you think
* Yellen encourages ‘fully-fledged equity bubble,’ says Jeremy Grantham
This Week: Must Know
This week has LOTS OF ECONOMIC DATA and earnings,
This Week: Economic Calendar

In approximately reverse chronological order we have:
1. July Jobs
2. July Unemployment
3. July Hourly Earnings
4. Initial and Continuing Weekly Claims
5. FOMC talking about interest rates and how the y will never change... unless they do.
6. Housing data.
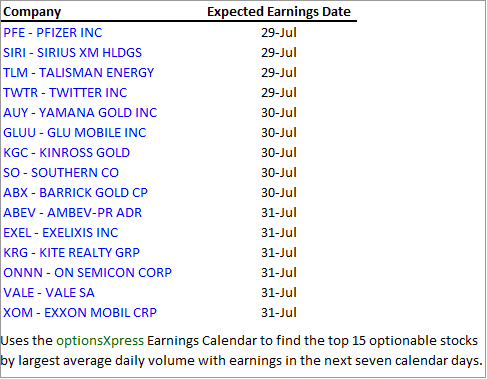
Partial List of Noteworthy Earnings This Week

Another reminder, though not on that list above...
- TSLA
- YELP
- HLF
This is trade analysis, not a recommendation.
Follow @OphirGottlieb
Tweet
Legal Stuff:
Options involve risk. Prior to buying or selling an option, an investor must receive a copy of Characteristics and Risks of Standardized Options. Investors need a broker to trade options, and must meet suitability requirements.
The information contained on this site is provided for general informational purposes, as a convenience to the readers. The materials are not a substitute for obtaining professional advice from a qualified person, firm or corporation. Consult the appropriate professional advisor for more complete and current information. I am not engaged in rendering any legal or professional services by placing these general informational materials on this website.
I specifically disclaim any liability, whether based in contract, tort, strict liability or otherwise, for any direct, indirect, incidental, consequential, or special damages arising out of or in any way connected with access to or use of the site, even if I have been advised of the possibility of such damages, including liability in connection with mistakes or omissions in, or delays in transmission of, information to or from the user, interruptions in telecommunications connections to the site or viruses.
I make no representations or warranties about the accuracy or completeness of the information contained on this website. Any links provided to other server sites are offered as a matter of convenience and in no way are meant to imply that I endorse, sponsor, promote or am affiliated with the owners of or participants in those sites, or endorse any information contained on those sites, unless expressly stated.


No comments:
Post a Comment