| Tweet |  |  |
AMZN is trading $360.49, up 0.7% with IV30™ up 3.3%. The Symbol Summary is included below.
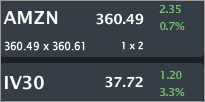
Provided by Livevol
------------------------------------------------------
Update 7-25-2014 (one-day later)
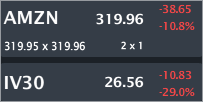
Provided by Livevol
The stock price is down nearly $55 and has collapsed through the option market's pricing zone. As you'll read below, the option market priced a range of [$337.50, $382.50] for AMZN on the close day. Here's how to figure that out before the event.
------------------------------------------------------
------------------------------------------------------
Update 8-1-2014 (one-week later)
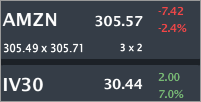
Provided by Livevol
------------------------------------------------------
Back to 7-24-2014
This is a pre-earnings note focusing on the stock price and of course, even more so, on the risk as reflected by the option market. This is an interesting one.
Conclusion
As with so many stocks right now, the option market is reflecting less risk now in AMZN earnings than it has in the last seven quarters. Thus far, that low risk premium has been correct as stocks like NFLX, AAPL and to a certain degree, FB have not moved huge on earnings. I believe AMZN may be different.
The option market is pricing a range of [$337.50, $382.50] by the end of trading on Friday.
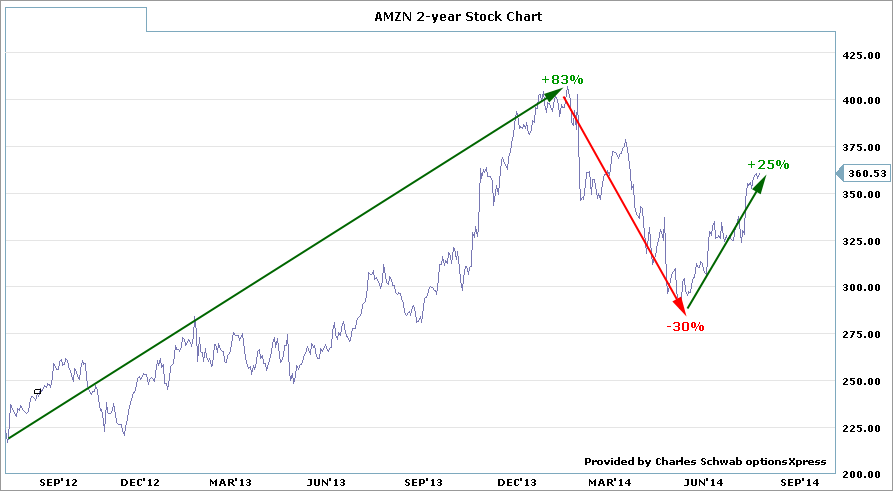
The two-year stock chart is included below.
Provided by Charles Schwab optionsXpress
This is a spectacular chart simply in that it so clearly shows the realization of momentum. AMZN went up 80%, then fell 30% and now has risen 25%. All within the span of two-years, and all pretty much in straight (ish) lines. This stock, as with so many others, moves in one direction for a prolonged period of time before it changes again.
The large swings are risky, the extended periods in between the swings may be considered less risky. Of course, that was the past -- we are looking to the future.
Let's turn to the IV30™ chart in isolation, below.
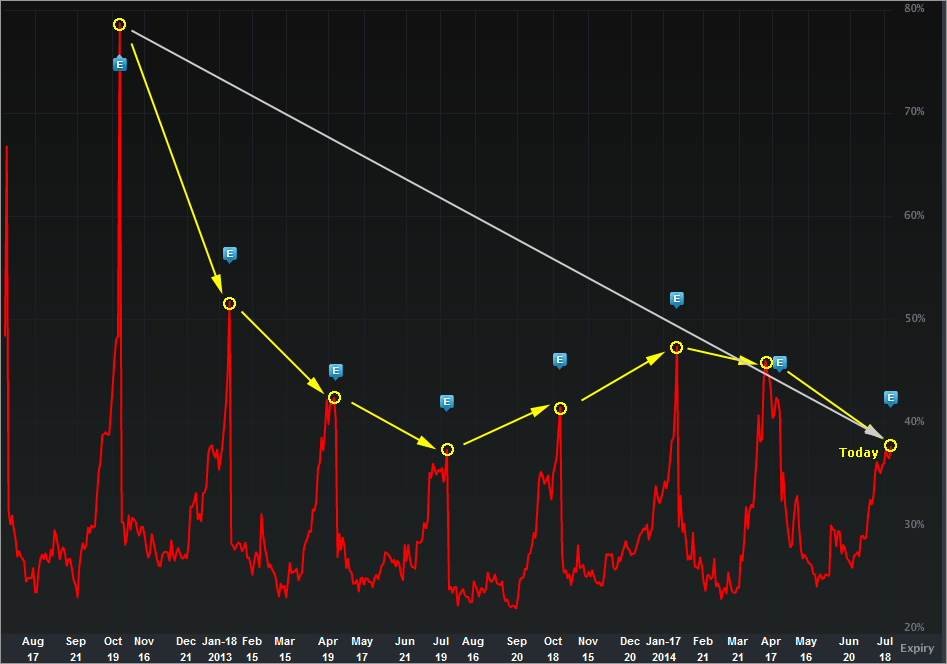
Provided by Livevol
The implied volatility is the forward looking risk in the equity price as reflected by the option market (IV30™ looks forward exactly 30 calendar days).
So the red curve is simply the "risk" of future stock price moves as priced by the options. Further, the blue "E" icons represent earnings dates. You will note that hypnotic risk of risk into earnings and then fall afterwards. That's normal and expected.
What isn't quite normal and not quite expected, is that the level of the risk today into earnings is lower than any of the prior earnings cycles in the last two-years.
The option market is clearly reading lower risk into this earnings report from AMZN.
We'll take a look at the actual numbers in a second, but one phenomenon to note (again) is that after earnings, the implied volatility (the red line) will drop substantially. If that red line drops to multi-year lows in the days following earnings (i.e. lower than any other point in that red chart), that's where the opportunity may lie as opposed to a one-day coin-flip earnings bet.
Finally, the Options Tab is included below.
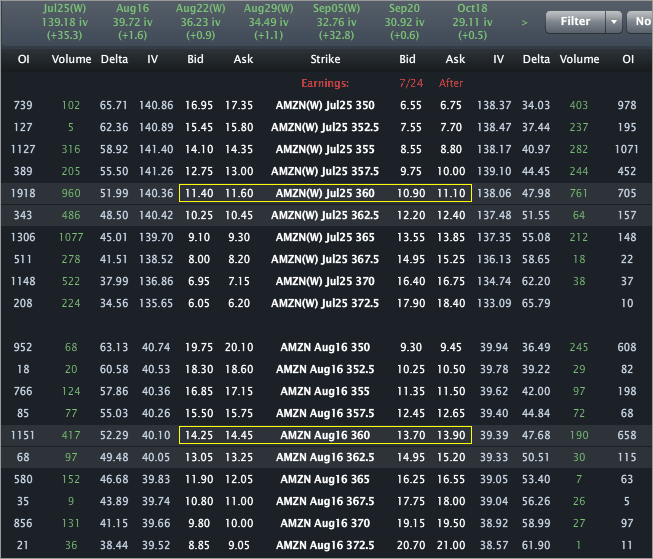
Provided by Livevol
Real number time...
Using the at-the-money (ATM) straddle in the July 25 weekly options we can see that the option market reflects a price range of [$337.50, $382.50].
Using the August monthly options (expiring Aug 15th), the option market reflects a price range of [$332, $388].
- If you believe the stock will be outside that range on expiry or any date before then, then you think the volatility is too low.
- If you believe that range is too wide, and that the stock will definitively be in that range on expiration, then you think volatility is too high.
- If you're not sure, and can make an argument for either case, then you think volatility is priced just about right.
This is trade analysis, not a recommendation.
Follow @OphirGottlieb
Tweet
Legal Stuff:
Options involve risk. Prior to buying or selling an option, an investor must receive a copy of Characteristics and Risks of Standardized Options. Investors need a broker to trade options, and must meet suitability requirements.
The information contained on this site is provided for general informational purposes, as a convenience to the readers. The materials are not a substitute for obtaining professional advice from a qualified person, firm or corporation. Consult the appropriate professional advisor for more complete and current information. I am not engaged in rendering any legal or professional services by placing these general informational materials on this website.
I specifically disclaim any liability, whether based in contract, tort, strict liability or otherwise, for any direct, indirect, incidental, consequential, or special damages arising out of or in any way connected with access to or use of the site, even if I have been advised of the possibility of such damages, including liability in connection with mistakes or omissions in, or delays in transmission of, information to or from the user, interruptions in telecommunications connections to the site or viruses.
I make no representations or warranties about the accuracy or completeness of the information contained on this website. Any links provided to other server sites are offered as a matter of convenience and in no way are meant to imply that I endorse, sponsor, promote or am affiliated with the owners of or participants in those sites, or endorse any information contained on those sites, unless expressly stated.


No comments:
Post a Comment