| Tweet |  |  |
NFLX is trading $442.01, up 0.6% with IV30™ down 3.6%. The Symbol Summary is included below.

Provided by Livevol
This is an earnings, stock and volatility note and a follow up to articles published in May, June and earlier in July. I have written about NFLX extensively and have included all of those posts below for review. Just reading the titles may be good enough for the flavor over the last three years.
In this market, volatility to the upside is as abrupt and risky as the downside.
Building Block of Humanity: Destruction is faster and more violent than creation.
Conclusion
The risk priced into this earnings release for NFLX is lower than any other in the last two years. Thus far, the risk priced by the option market in NFLX shares has been a total and complete failure of the option market to recognize the volatility in the underlying shares, and in many way, has (in the last two months) created one of the greatest trading opportunities ever.
One of the fundamental building blocks of human kind, which is built into option prices, has broken down in this bull market. It's an extraordinary event, and one that deserves serious attention because it is evidence of a bubble.
7-1-2014
NFLX - All-time Highs & One of the Greatest Trading Opportunities Ever
6-17-2014
How the Option Market is Totally Wrong; Proof that Market Volatility Has Lost Its Mind
5-21-2014
NFLX - The Option Market is Dead Wrong... Again
4-17-2014
NFLX - Earnings Preview: My Bologna Has a First Name: c.o.m.p.e.t.i.t.i.o.n.; A Reckoning is Coming with Earnings.
4-14-2014
NFLX - The Reckoning is Coming with Earnings. Here's the Risk in the Stock Right Now.
3-24-2014
NFLX - How the Option Market Totally Blew It... And We Knew it a Month Ago. Momentum Stocks are Deflating... Right Now.
2-13-2014
NFLX - Unprecedented Low Risk?... How Many Times Will the Option Market Prove Wrong? And is it Right This Time?
1-21-2014
NFLX - Earnings Preview: "Less Risk in This Firm Now than In the Last Two-Years." Do You Agree? I'm Not Sure I Do.
12-27-2014
NFLX - The Giant Killer is a Giant, But the Option Market is Still Asleep. What Happens When it Wakes Up?
11-26-2013
NFLX - This Newly Minted Giant Has a Big Secret; But It's in the Option Market...
10-15-2013
NFLX - How a New Industry Giant Shows 'Cheap' (?) Volatility into Earnings; Did You Know This?
9-18-2013
Netflix (NFLX) - The New Giant -- Stock Near All-time High but Volatility Collapses to Multi-year Low
9-10-2013
NFLX - Is this the Most Powerful Firm in Entertainment? Some Things I Bet You Didn't Know... But Want to.
4-25-2013
Netflix (NFLX) - Vol Nears Multi-Year Lows as Stock Explodes; Hollywood Take Note -- Another Shot Across Major Distributor’s Bows
OK, on to today...
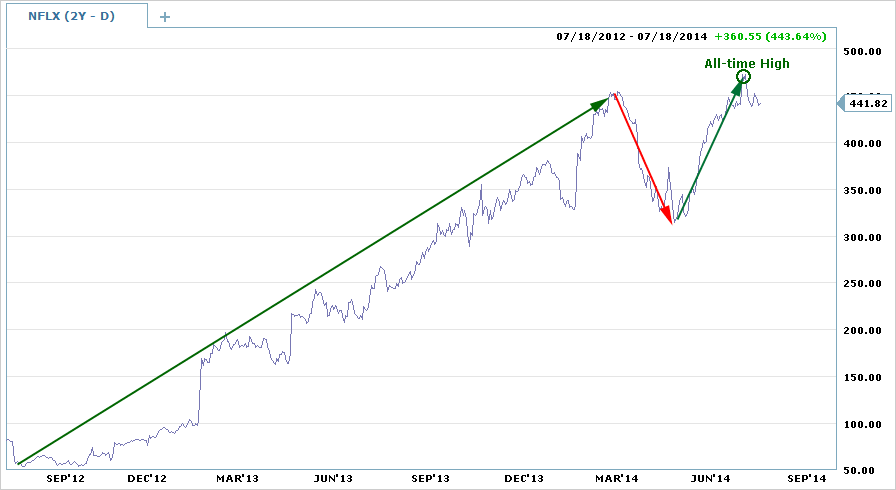
The two year stock chart is included below.

Provided by Charles Schwab optionsXpress
NFLX is up 444% in the last two-years, thank you very much, but it's the near-term movement that has my eye (and I'm sure, yours as well).
The stock hit an all-time high (at the time) of ~$455 in early March, then hit a nasty MOMO stock deflation down to ~$315... Note that price drop in a very short period of time -- that's no joke... There's "risk" story #1.
After that low, NFLX moved more abruptly to the upside all the way back and ABOVE $455 to $475. This is risk story #2 and is contrary to a building block of nature.
I have said this before, please hear me.
In this market, volatility to the upside is as abrupt and risky as the downside.
The option market has not caught onto this phenomenon because ever since... forever... as stocks rise, implied volatility (the option market's measure of stock rise) falls. This is not only the basis of option skew pricing, but also the fundamental building block of human kind.
Destruction is faster and more violent than creation.
That fundamental theorem of nature exists in the pricing of options and it is incorrect right now. That stock chart and those articles (most recent three) that I included above are evidence of this broken down truth. This truth breaks down in a bubble.
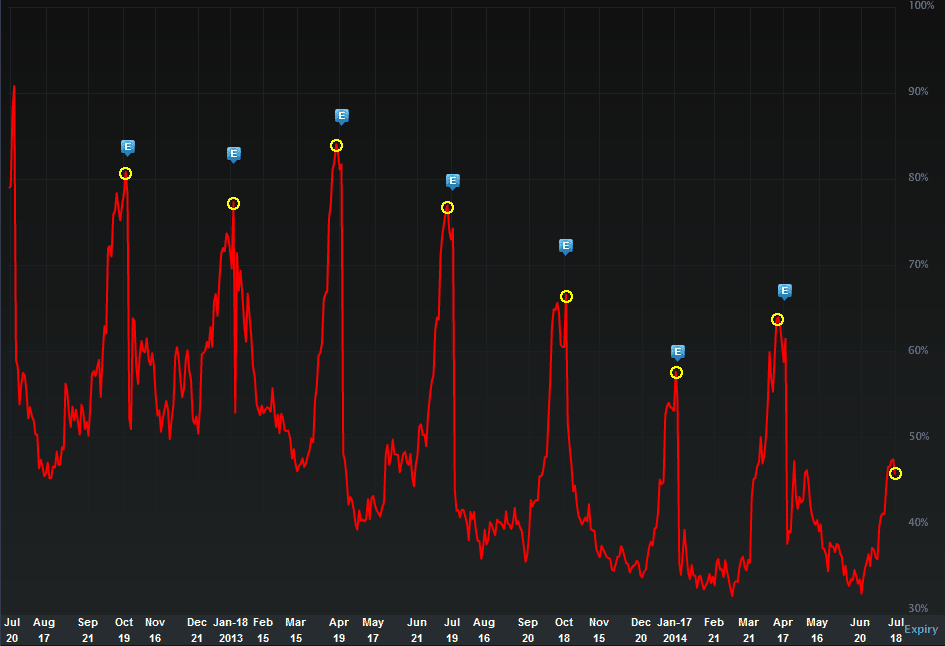
Let's turn to the IV30™ chart in isolation, below.

Provided by Livevol
The implied volatility is the forward looking risk in the equity price as reflected by the option market (IV30™ looks forward exactly 30 calendar days). So, that red line is the risk and those yellow circles show the risk at the time of the last seven earnings cycles for NFLX.
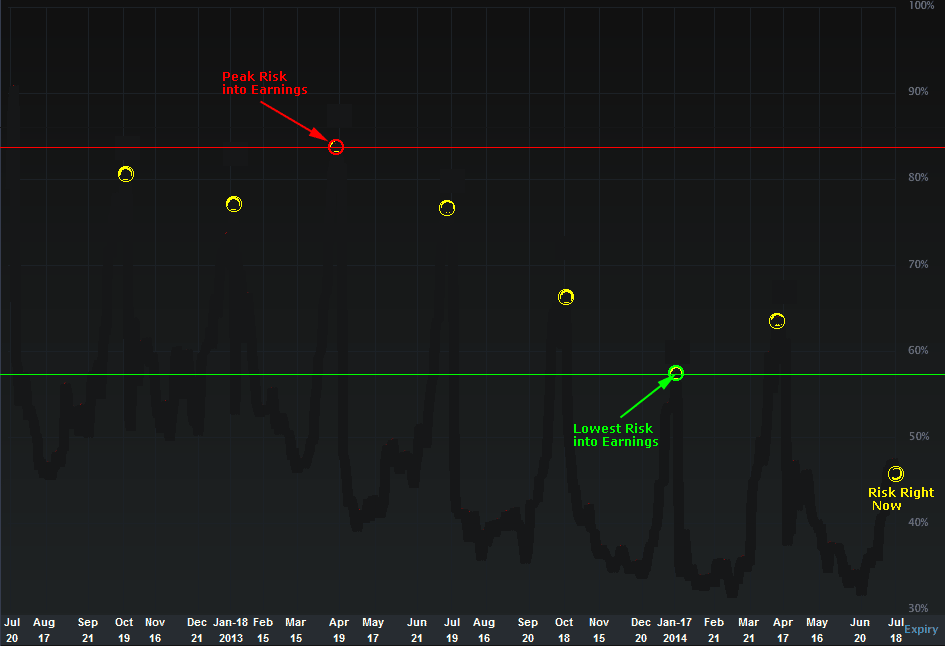
Let's focus on just the earnings dates, below.

Provided by Livevol
We can see the peak risk was in April 2013 at 84%, and the bottom was Jan 2014 at 58%. Today the IV30 is at 45.75%, substantially below even the trough in the last two years (for earnings dates).
What. The. Hell. Is. Going. On. In. The. Option. Market?
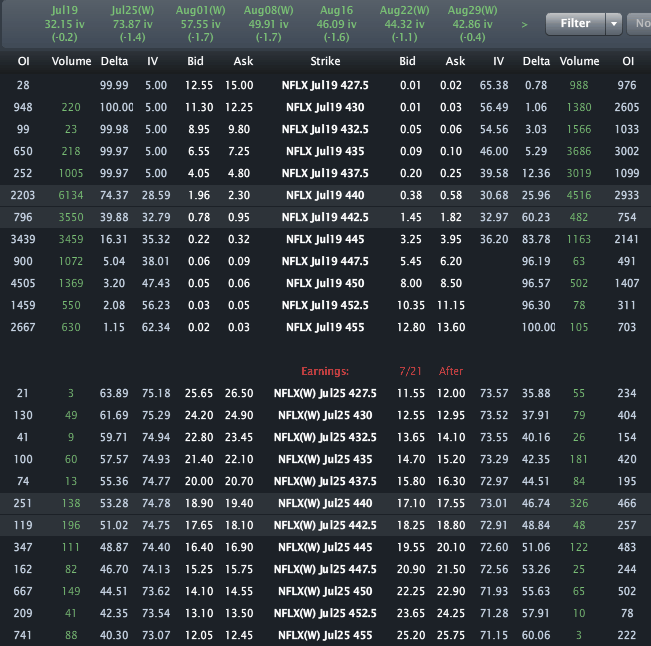
Finally, the Options Tab is included below.

Provided by Livevol
Using the at-the-money (ATM) straddle in the July 25 weekly options we can see that the option market reflects a price range of [$406, $478].
Using the Aug monthly expiration that price range is [$395, $485] (August 15th expiration).
- If you believe the stock will be outside that range on expiry or any date before then, then you think the volatility is too low.
- If you believe that range is too wide, and that the stock will definitively be in that range on expiration, then you think volatility is too high.
- If you're not sure, and can make an argument for either case, then you think volatility is priced just about right.
I am not recommending a trade, a position, an anything. I am pointing out facts which are backwards looking, not forward telling.
This is trade analysis, not a recommendation.
Follow @OphirGottlieb
Tweet
Legal Stuff:
Options involve risk. Prior to buying or selling an option, an investor must receive a copy of Characteristics and Risks of Standardized Options. Investors need a broker to trade options, and must meet suitability requirements.
The information contained on this site is provided for general informational purposes, as a convenience to the readers. The materials are not a substitute for obtaining professional advice from a qualified person, firm or corporation. Consult the appropriate professional advisor for more complete and current information. I am not engaged in rendering any legal or professional services by placing these general informational materials on this website.
I specifically disclaim any liability, whether based in contract, tort, strict liability or otherwise, for any direct, indirect, incidental, consequential, or special damages arising out of or in any way connected with access to or use of the site, even if I have been advised of the possibility of such damages, including liability in connection with mistakes or omissions in, or delays in transmission of, information to or from the user, interruptions in telecommunications connections to the site or viruses.
I make no representations or warranties about the accuracy or completeness of the information contained on this website. Any links provided to other server sites are offered as a matter of convenience and in no way are meant to imply that I endorse, sponsor, promote or am affiliated with the owners of or participants in those sites, or endorse any information contained on those sites, unless expressly stated.


As a layman to me Low IV means long term interest on stock or balance of risk takers or low volume or someone controls both sides effectively to suck in both bears and bulls.
ReplyDelete