


| Tweet |  |  |
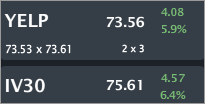
YELP is trading $73.56, up 5.9% small with IV30™ up 6.4%. The Symbol Summary is included below.
Provided by Livevol
-----
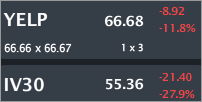
UPDATE: 7-31-2014 (mid-day)
Provided by Livevol
While the stock is down ~12%, it's also caught in the headwinds of a down market day (which we knew was coming from the "Prepare for the Week to Come" post, right?). Thus far, the tail move has not happened and that crazy looking skew was correct. Still a day and a half to go to be sure.
-----
This is stock and vol note surrounding earnings, and something different: an incredible change in the skew. If you don't know what skew is, keep reading, you'll know in about two minutes, and this change will shock you.
Conclusion
The risk going into YELP earnings is lower than the prior four quarters and has broken a streak of increasing risk into earnings for each event one-after-the-other (charts below to turn that sentence into English). But the eye-popping phenomenon is the skew shape -- which I have almost never seen before in this type of setting.
- The option market reflects a price range of [$64.50, $82.50] by the end of trading on Aug 1.
- Option market is pricing a lower risk to a tail event (in any direction) ahead of earnings.
- Option market is pricing a lower risk to a tail event (in any direction) ahead of earnings.
$YELP not a fan of stock (big fan of site), but w expansion of API call limit, gotta think mobile "users" beat estimates. EPS: no idea.
— Ophir Gottlieb (@OphirGottlieb) July 29, 2014
The two-year stock chart is included below.

Provided by Charles Schwab optionsXpress
Over the last two-years YELP stock has risen 257%. Wow. The stock chart shows three distinct pieces:
- Period #1: The stock rose from 437% from 11-6-2014 to 3-4-2014.
- Period #2: The stock dropped 47% from 3-4-2014 to 5-6-2014.
- Period #3: The stock rose 40% from 5-7-2014 to the present.
Note that since the peak run into 3-4-2014, the stock is down 27%.
So the point of those number is simply that the stock has tail risk (to both sides). Remember that, it's critical to the skew discussion coming up in one more chart.
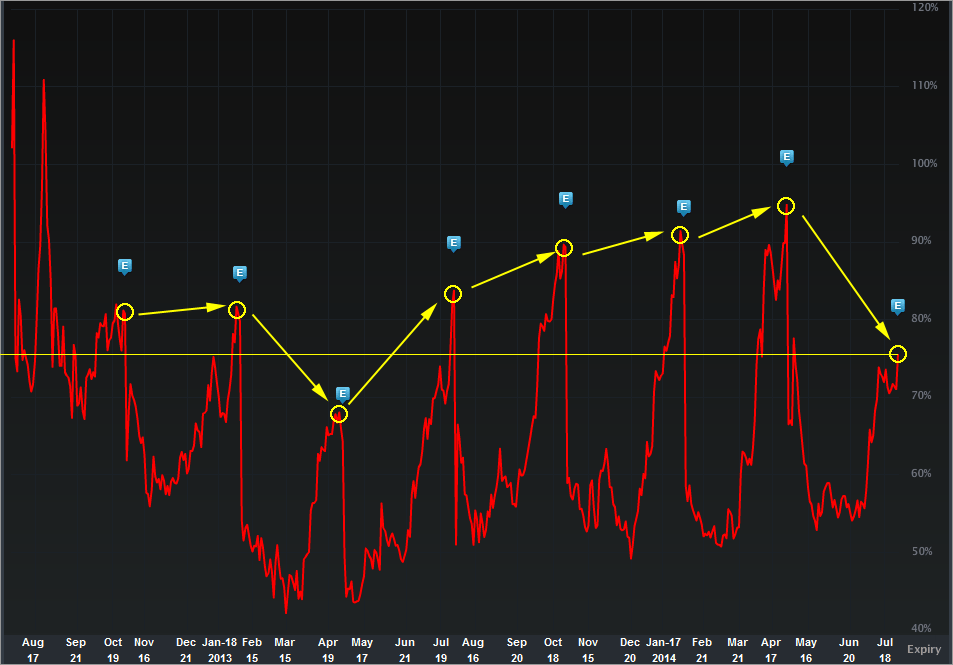
First, let's turn to the IV30™ chart in isolation, below.
Provided by Livevol
The implied volatility is the forward looking risk in the equity price as reflected by the option market (IV30™ looks forward exactly 30 calendar days). In English, the red curve is the risk in future stock price movement.
The blue "E" icons represent earnings events (circled in yellow), and we can see that the risk into earnings for YELP had increased for four straight quarters from 68% to 95%. As of today, however, IV30™ is priced at 76%. So that rising streak of risk into earnings has ended.
Whether or not you feel the risk in YELP stock price is lower or higher than the last earnings releases is opinion, of course. What is not an opinion is what I'm about to show you....
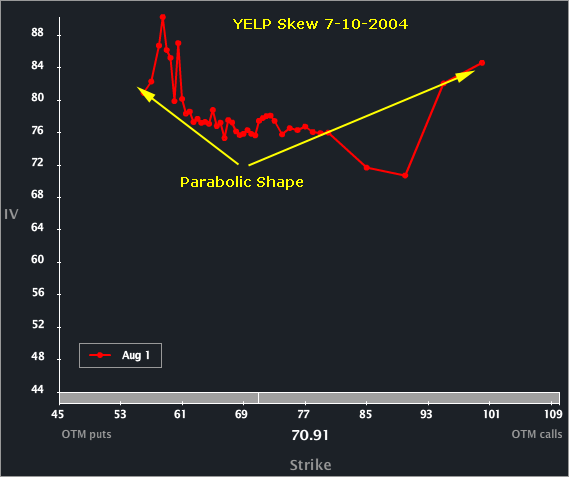
The Skew Tab snap (below) illustrates the vols by strike. First, let's look at the Aug1 weekly option skew as of 7-10-2014 (twenty days ago).
Provided by Livevol
Although it's a bit messy, we can see that the volatility in the options by strike rise as we go down (left) from the current stock price (at-the-money or ATM) and it rises as we go up from the ATM (to the right). This is called parabolic skew (for obvious reasons) and while it's not considered "normal" skew, it's not terribly unusual in a stock like YELP (bursting revenue, no earnings, massively volatile stock).
But now, let's turn to the Skew Tab for YELP today, looking at those same Aug1 options.
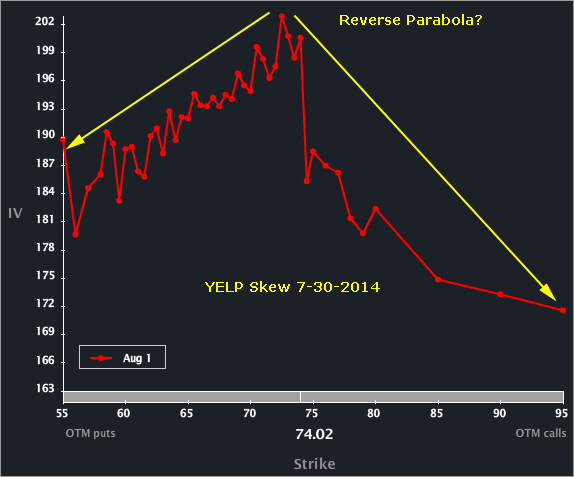
Provided by Livevol
This is utterly bizarre. The risk moving away from ATM is lower both to the downside and the upside. Say what?
In English, the option market is pricing a lower risk to a tail event (in any direction) ahead of earnings than it did 20-days before earnings. That's crazy weird since earnings are a risky (volatile) event. In fact, I don't even remember seeing a skew like this into earnings.
If you believe YELP has tail risk, this chart means a lot to you.
To read more about skew, what is and why it exists you can click the title below:
Understanding Option Skew -- What it is and Why it Exists.
Finally, the Options Tab is included below.

Provided by Livevol
Using the at-the-money (ATM) straddle in the Aug1 weekly options we can see that the option market reflects a price range of [$64.50, $82.50] by the end of trading on Aug 1.
- If you believe the stock will be outside that range on expiry or any date before then, then you think the volatility is too low.
- If you believe that range is too wide, and that the stock will definitively be in that range on expiration, then you think volatility is too high.
- If you're not sure, and can make an argument for either case, then you think volatility is priced just about right.
I have no opinion on this one other than a low probability bet on a tail move is priced too cheaply (that's an opinion). So, for example, while the odds of a tail move are 25% (that's a made up number), the option market is pricing something like 15% (also a made up number). The point is the differential. That means a bet on a tail move, while still likely to lose, has a greater payoff than the odds if this were priced "normally" i.e. parabolically.
Absolutely fascinating... and confounding.
This is trade analysis, not a recommendation.
Follow @OphirGottlieb
Tweet
Legal Stuff:
Options involve risk. Prior to buying or selling an option, an investor must receive a copy of Characteristics and Risks of Standardized Options. Investors need a broker to trade options, and must meet suitability requirements.
The information contained on this site is provided for general informational purposes, as a convenience to the readers. The materials are not a substitute for obtaining professional advice from a qualified person, firm or corporation. Consult the appropriate professional advisor for more complete and current information. I am not engaged in rendering any legal or professional services by placing these general informational materials on this website.
I specifically disclaim any liability, whether based in contract, tort, strict liability or otherwise, for any direct, indirect, incidental, consequential, or special damages arising out of or in any way connected with access to or use of the site, even if I have been advised of the possibility of such damages, including liability in connection with mistakes or omissions in, or delays in transmission of, information to or from the user, interruptions in telecommunications connections to the site or viruses.
I make no representations or warranties about the accuracy or completeness of the information contained on this website. Any links provided to other server sites are offered as a matter of convenience and in no way are meant to imply that I endorse, sponsor, promote or am affiliated with the owners of or participants in those sites, or endorse any information contained on those sites, unless expressly stated.
No comments:
Post a Comment