| Tweet |  |
SSYS is trading $107.84, down small with IV30™ down 0.4%. The Symbol Summary is included below.
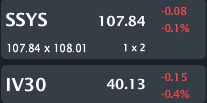
Provided by Livevol
I just posted as note on DDD, another big player in the 3-D printing world. You can read that post here:
3D Systems (DDD) - Whipping Stock Shows Low Risk; A Mispricing and a Major Unknown.
The point of that article surrounded the firm specific risk for DDD, and in a broader sense, all of the 3-D printing firms. Allow myself to quote myself (Austin Powers):
"The technology realm it participates in is incredible. But, like all disruptive technologies, there will be winners and losers and it's damn hard to figure out which will be which until it's often too late to profit from."
Conclusion
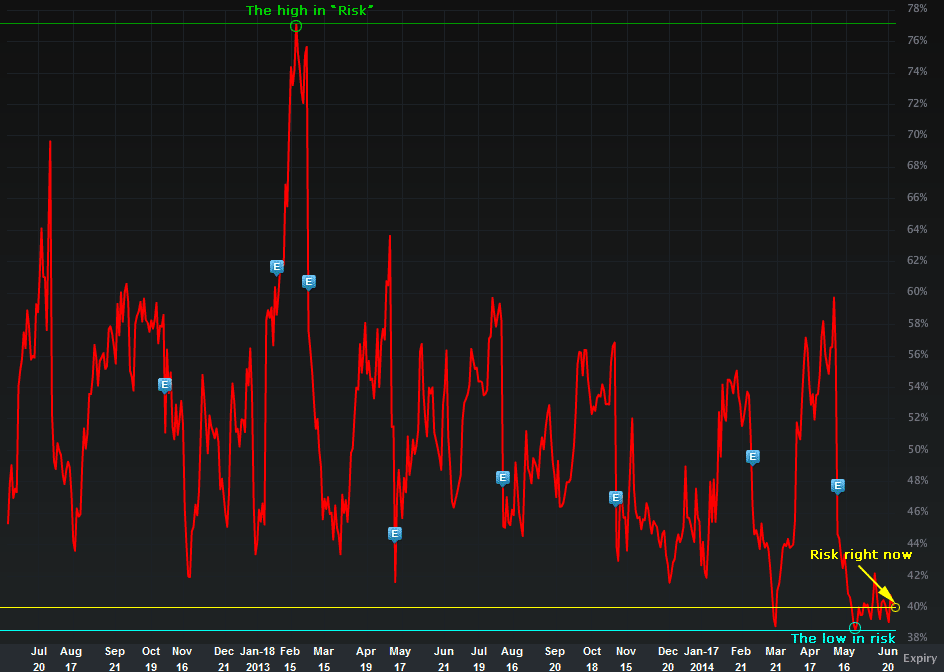
SSYS has seen a gigantic run up in stock over the long run, a hard drop in the ever so short deflationary period surrounding MOMO stocks, and has rebounded very nicely. There's no doubt that the stock can whipsaw. But... the option market is pricing in less risk now than essentially at any point in the last two-years. That's a correlation phenomenon, specifically to the VIX (S&P 500). The real question is: Doesn't SSYS have firm specific risks right now well outside of the broader market?.. And, if so, doesn't that mean risk shouldn't be at multi-year lows?
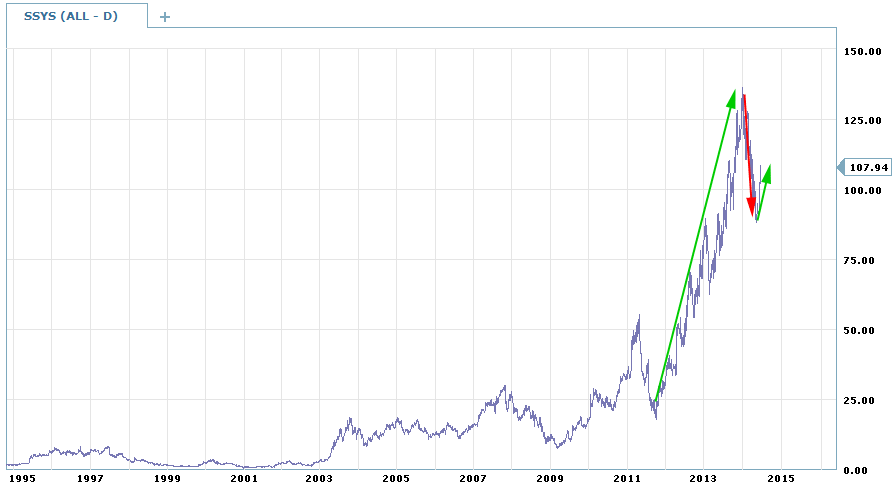
Let's turn to the all-time stock chart, below.
Provided by Charles Schwab optionsXpress
So, the run up is awesome. The stock peaked at $138.10 on 1-3-2014, then imploded with all the other MOMOs down to $85.30 on 5-9-2014. That's a 38% drop in five months. But...
Since 5-9-214, the stock is now up 26% in six weeks. If we look back at the stock chart (above), we can see those moves pretty clearly (I even drew the arrows in there... I like arrows, what are you gonna do?).
So what? The point is simply that SSYS stock is moving with great volatility. The daily moves are small (in general), but the cumulative moves are large. But...
Let's turn to the IV30™ chart in isolation, below.
Provided by Livevol
The implied volatility is the forward looking risk in the equity price as reflected by the option market (IV30™ looks forward exactly 30 calendar days). I have drawn in the peak of risk (green) and the low of risk (blue) in the last two-years as reflected by the option market. Further, I have drawn in the line for the current risk (yellow).
So... Why is SSYS risk as reflected by the option market so low?
Well, I actually do have an answer. You can find it in this post (or just read the title):
How the Option Market is Totally Wrong; Proof that Market Volatility Has Lost Its Mind.
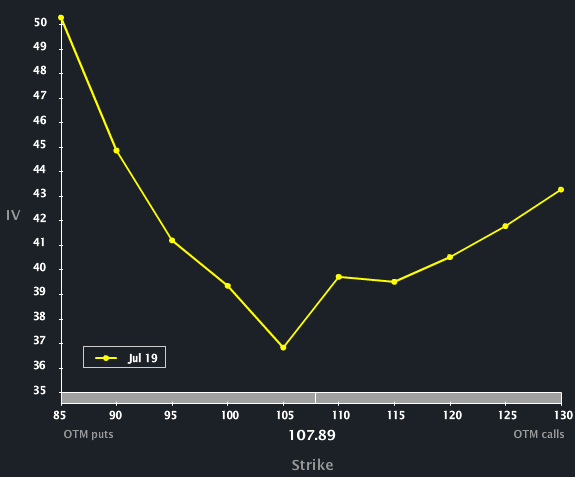
Now let's turn to the Skew Tab snap (below), which illustrates the vols (risk) by strike.
Provided by Livevol
We can see the SSYS has maintained a parabolic shaped skew, which means the option market reflects an equal (ish) likelihood of a tail move either up or down. This is abnormal skew in general, but par for the course for SSYS.
To read more about skew, what is and why it exists you can click the title below:
Understanding Option Skew -- What it is and Why it Exists.
Finally, the Options Tab is included below.
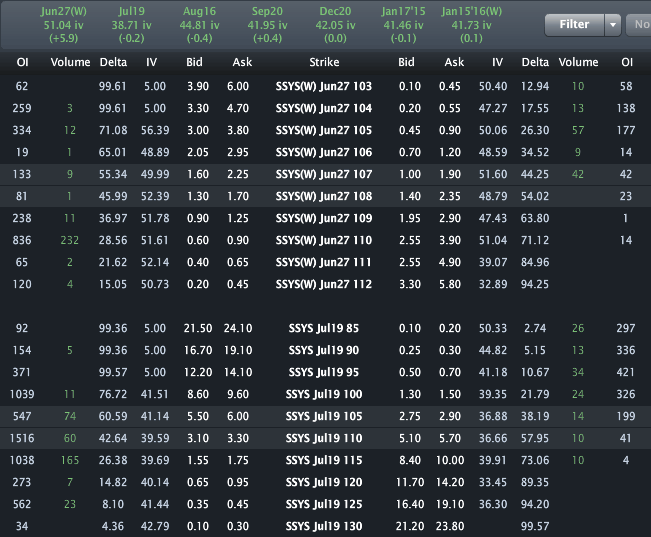
Provided by Livevol
Using the at-the-money (ATM) straddle in the July monthly options we can see that the option market reflects a price range of [$101, $119].
- If you believe the stock will be outside that range on expiry or any date before then, then you think the volatility is too low.
- If you believe that range is too wide, and that the stock will definitively be in that range on expiration, then you think volatility is too high.
- If you're not sure, and can make an argument for either case, then you think volatility is priced just about right.
DISCLOSURE: I am long SSYS shares.
This is trade analysis, not a recommendation.
Follow @OphirGottlieb
Tweet
Legal Stuff:
Options involve risk. Prior to buying or selling an option, an investor must receive a copy of Characteristics and Risks of Standardized Options. Investors need a broker to trade options, and must meet suitability requirements.
The information contained on this site is provided for general informational purposes, as a convenience to the readers. The materials are not a substitute for obtaining professional advice from a qualified person, firm or corporation. Consult the appropriate professional advisor for more complete and current information. I am not engaged in rendering any legal or professional services by placing these general informational materials on this website.
I specifically disclaim any liability, whether based in contract, tort, strict liability or otherwise, for any direct, indirect, incidental, consequential, or special damages arising out of or in any way connected with access to or use of the site, even if I have been advised of the possibility of such damages, including liability in connection with mistakes or omissions in, or delays in transmission of, information to or from the user, interruptions in telecommunications connections to the site or viruses.
I make no representations or warranties about the accuracy or completeness of the information contained on this website. Any links provided to other server sites are offered as a matter of convenience and in no way are meant to imply that I endorse, sponsor, promote or am affiliated with the owners of or participants in those sites, or endorse any information contained on those sites, unless expressly stated.


No comments:
Post a Comment