| Tweet |  |
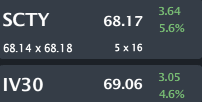
SCTY is trading $68.17, up 5.6% with IV30™ up 4.6%. The Symbol Summary is included below.
Provided by Livevol
SolarCity Corporation (SolarCity) is engaged in the design, installation and sale or lease of solar energy systems to residential and commercial customers, or sale of electricity generated by solar energy systems to customers.
This is a stock and volatility note in an equity that has been absolutely ripping over the last several days and a good deal of the news has been based on... we have no idea... This was $54 stock two days ago and is now up 26% in that time frame.
Conclusion
We are nowhere near equilibrium and risk is building. SCTY does have a redeeming phenomenon that's been developing: the option market is starting to reflect risk. But, much like many other stocks, the option market has been (prior) reflecting far too little risk. Rather than repeat myself, you can read my definitive post on that subject from yesterday (6-17-2014), here:
Absurdity Has Set in: Proof that Market Volatility Has Absolutely Lost Its Mind.
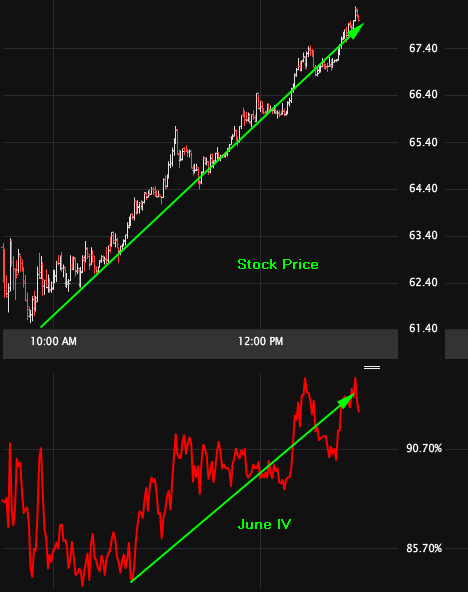
Before we get into some longer period analysis, just today's move alone is worth noting. After going from a low of $54.25 yesterday and then up to a close of $64.53, SCTY actually opened down ($63.26) today, hit a day low of $61.55, and has exploded up since then.
The day Tick Chart is included below (the top is the stock price, the bottom is the Jun option implied volatility.
Provided by Livevol
Note that the stock price turned hard to the upside and has moved abruptly higher in just a few hours. Quoting myself from yesterday's post:
"While volatility is often times (most times) associated with downside risk, if there's anything we can learn from the current market it's that, upside moves can be as abrupt and as large as downside moves."
Well, this is exhibit 1A.
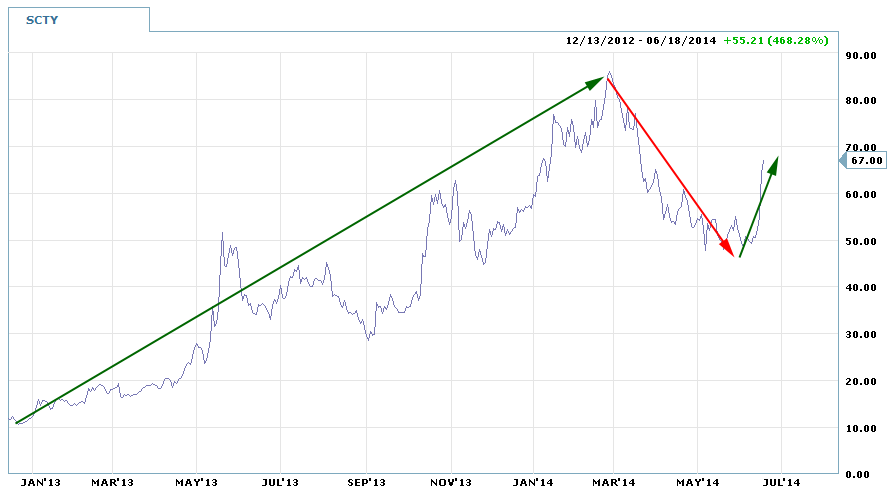
Let's turn to the all-time stock chart, below.
Provided by Charles Schwab optionsXpress
We can see an all-time stock appreciation of 468%, but that's not the entire story. SCTY suffered with the rest of the MOMO stocks in that rather brief but abrupt period of bubble deflation. SCTY hit a low of $46.11 on 6-4-14, and has since boomed up 48% in the last two-weeks.
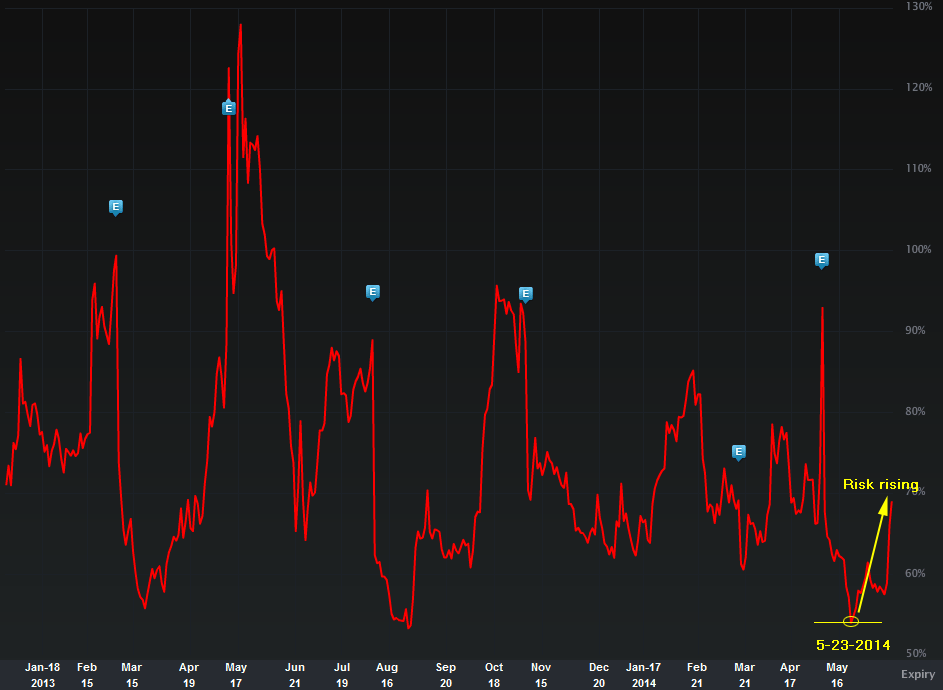
But there's more to this story... and it's in the option market. Let's turn to the IV30™ chart in isolation, below.
Provided by Livevol
The implied volatility is the forward looking risk in the equity price as reflected by the option market (IV30™ looks forward exactly 30 calendar days). We can see that risk as reflected by the option market actually bottomed out very recently (see that yellow line I drew in), and has since risen with the stock price. That's actually good news and less absurd than what we see with NFLX, TSLA, TWTR and of course, SPX.
This is evidence of another "axiom" that is mostly but not always true:
"Stock price and implied volatility move in opposite directions."
Not this time... not for NFLX, TSLA, TWTR, SCTY and another hundred (or whatever) MOMO stocks.
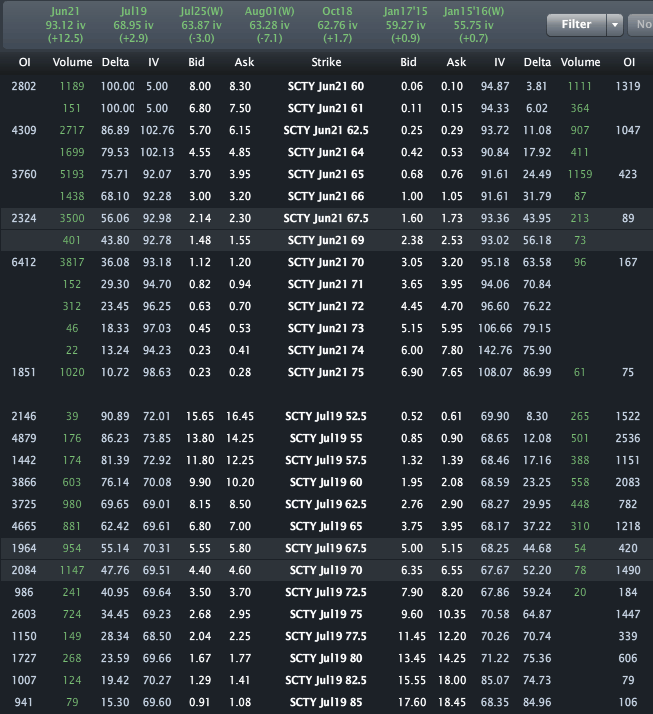
Finally, the Options Tab is included below.
Provided by Livevol
Using the at-the-money (ATM) straddle in the July options, we can see that the option market reflects a price range of [$57.00, $78.00].
- If you believe the stock will be outside that range on expiry or any date before then, then you think the volatility is too low.
- If you believe that range is too wide, and that the stock will definitively be in that range on expiration, then you think volatility is too high.
- If you're not sure, and can make an argument for either case, then you think volatility is priced just about right.
This is trade analysis, not a recommendation.
Follow @OphirGottlieb
Tweet
Legal Stuff:
Options involve risk. Prior to buying or selling an option, an investor must receive a copy of Characteristics and Risks of Standardized Options. Investors need a broker to trade options, and must meet suitability requirements.
The information contained on this site is provided for general informational purposes, as a convenience to the readers. The materials are not a substitute for obtaining professional advice from a qualified person, firm or corporation. Consult the appropriate professional advisor for more complete and current information. I am not engaged in rendering any legal or professional services by placing these general informational materials on this website.
I specifically disclaim any liability, whether based in contract, tort, strict liability or otherwise, for any direct, indirect, incidental, consequential, or special damages arising out of or in any way connected with access to or use of the site, even if I have been advised of the possibility of such damages, including liability in connection with mistakes or omissions in, or delays in transmission of, information to or from the user, interruptions in telecommunications connections to the site or viruses.
I make no representations or warranties about the accuracy or completeness of the information contained on this website. Any links provided to other server sites are offered as a matter of convenience and in no way are meant to imply that I endorse, sponsor, promote or am affiliated with the owners of or participants in those sites, or endorse any information contained on those sites, unless expressly stated.


No comments:
Post a Comment