| Tweet |  |
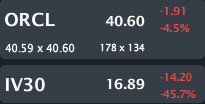
ORCL is trading $40.60, down 4.5% with IV30™ down 45.7%. The Symbol Summary is included below.
Provided by Livevol
Conclusion
ORCL has $22.6.B in long-term debt as of Feb. 28, 2014 (balance sheet). In May 2012, that number was $13.5B. So, basically ORCL has borrowed ~$9B cheap in the last year, as the Fed keeps rates near zero, in order to buyback ~$10B of its own stock, pushing the buyback to unprecedented levels. The buybacks in-and-of-themselves aren't entirely damning evidence. But, what creeps into this discussion is the size of these buybacks relative to... ever...
ORCL will eventually stop buying back stock. It will eventually stop borrowing tens of billions, and that means the largest single buyer of stock will go away (or drop). That's not just a risky event, that's a crazy risky event.
This is a stock, volatility and, more than anything else, a reality check note on ORCL and even somewhat more broadly on the S&P 500. Much of the discussion here surrounding stock buybacks was motivated (and inspired) by a set of articles published by Zero Hedge. I highly recommend reading both the posts (very short reads, lots of information), below.
The Most Stunning Chart From Oracle's Earnings Report, written by Tyler Durden.
Here Is The Mystery, And Completely Indiscriminate, Buyer Of Stocks In The First Quarter, written by Tyler Durden.
Want some more motivation to read the posts above?... Here's a quote:
"[D]espite all the propaganda, the stock market surge is completely fake, driven by nothing more than the Fed and companies buying back their own stock, as is the so-called "economic recovery."
And another one:
"According to the most recent CapitalIQ data, the single biggest buyer of stocks in the first quarter were none other than the companies of the S&P500 itself, which cumulatively repurchased a whopping $160 billion of their own stock in the first quarter!"
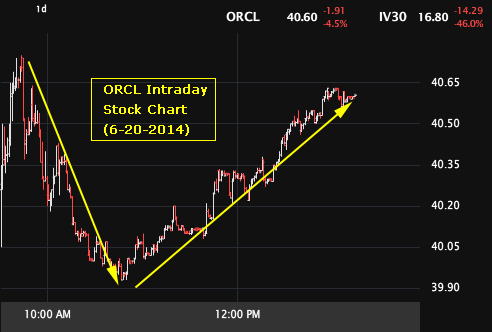
Before we get into that stock buyback issue (which is a huge one), let's turn to the intraday Tick Chart for ORCL, below.
Provided by Livevol
Note the small sell-off in the morning (after gapping lower on open) and now a modest recovery back to the opening levels. The point: there hasn't been a gigantic reaction or any kind of panic. This is a rather orderly decline off of earnings.
Now, let's turn to the stock buyback issue:

Provided by Zero Hedge
Tyler's commentary is rather jarring. If you haven't read his article yet, please scroll up and click on the link, trust me... it's worth it.
In any case, the chart above illustrates how much money ORCL has spent on stock buybacks with a side-by-side comparison of ORCL's quarterly spending on capital expenditures.
Tyler's view:
"It speaks for itself, and also explains very succinctly why despite all the propaganda, the stock market surge is completely fake, driven by nothing more than the Fed and companies buying back their own stock, as is the so-called "economic recovery."
ORCL does pay a dividend, so it's not totally unholy for a firm that has so much free cash flow that after spending on CapEx there's money to be distributed to shareholders. The two ways to do that are (1) dividends and (2) a stock buy back.
The buybacks in-and-of-themselves aren't entirely damning evidence. But, what creeps into this discussion is the size of these buybacks relative to basically... ever...
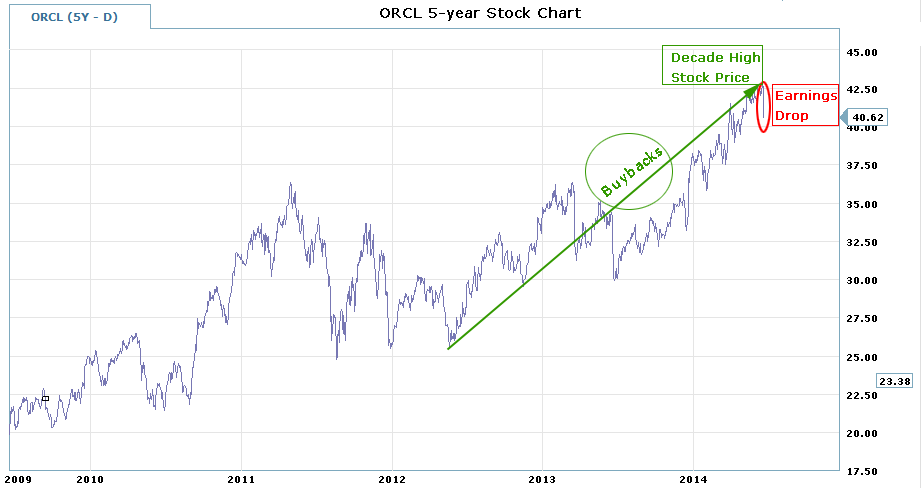
Now, let's turn to the 5-year stock chart.
Provided by Charles Schwab optionsXpress
ORCL has essentially doubled over the time period (5-years), had just hit a decade high in stock price right before the stock drop today off of a disappointing earnings release. I do note that the stock traded above $45 ever so briefly back in the final hours of the Internet bubble (in 2000).
More interesting is how quickly the price has appreciated in the recent times. As the stock buyback chart demonstrates, ORCL has purchased over $20B of its own stock in two-years. Let's keep in mind that ORCL is a $180B market cap firm so $20B isn't CRAZY... But it is more than we have ever seen.
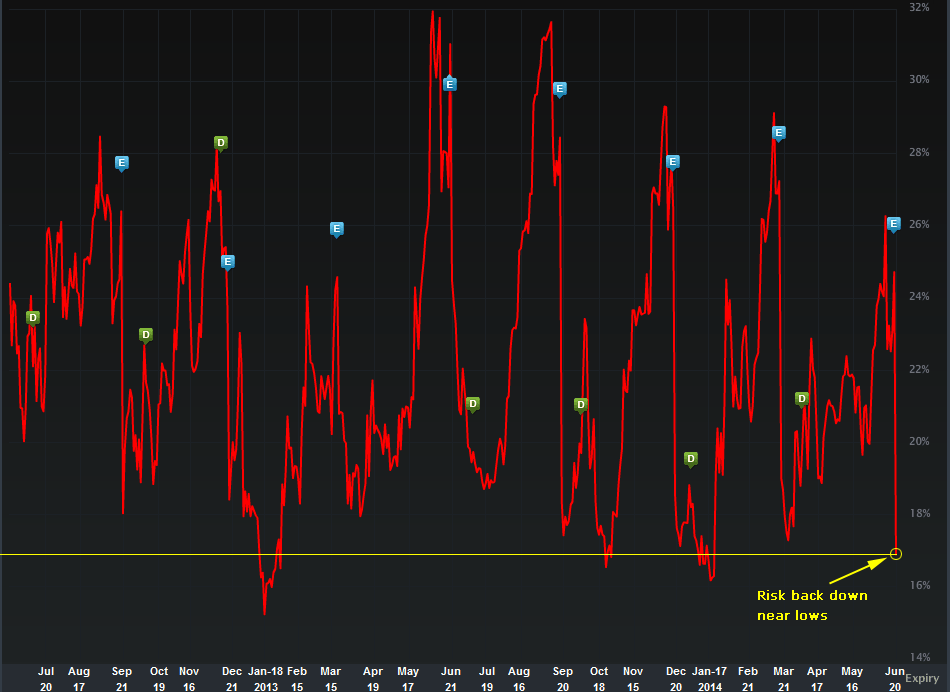
Now let's turn to the IV30™ chart in isolation, below.
Provided by Livevol
The implied volatility is the forward looking risk in the equity price as reflected by the option market (IV30™ looks forward exactly 30 calendar days). The volatility collapse after earnings is normal, and actually has a name: "Vol Crush." This occurs because all of the uncertainty heading into earnings is finally gone (good or bad news), so risk should drop hard after the release.
The question is, how far should the risk drop? According to the option market, risk should drop to near annual lows, and just above multi-year lows...
Here's the thing... At some point interest rates will rise (right?), unless we are in a "Japan economy," in which case, we're f*ed.
ORCL has $22.6.B in long-term debt as of Feb. 28, 2014 (balance sheet). In May 2012, that number was $13.5B. So, ORCL has borrowed $9B cheap in the last year as the Fed keeps rates near zero in order to buyback ~$10B of its own stock, pushing the buyback to unprecedented levels.
ORCL will eventually stop buying back stock. It will eventually stop borrowing tens of billions, and that means the largest single buyer of stock will go away (or drop). That's not just a risky event, that's a crazy risky event.
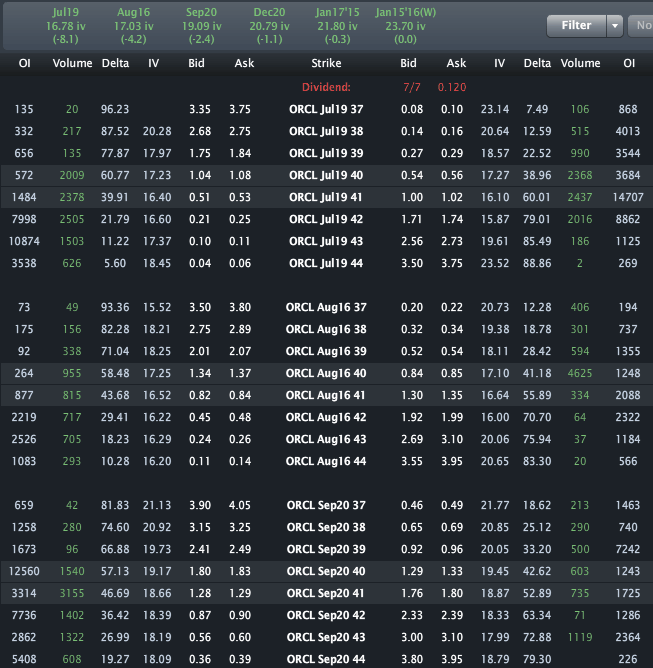
To see just how low risk is priced in actual $ terms, the Options Tab is included below.
Provided by Livevol
Using the at-the-money (ATM) straddle in September we can see that the option market reflects a price range of [$36.90 ,$43.10].
For August, we get: [$37.80, $42.20].
I mean, that's one hell of a tight range.
- If you believe the stock will be outside that range on expiry or any date before then, then you think the volatility is too low.
- If you believe that range is too wide, and that the stock will definitively be in that range on expiration, then you think volatility is too high.
- If you're not sure, and can make an argument for either case, then you think volatility is priced just about right.
This is trade analysis, not a recommendation.
Follow @OphirGottlieb
Tweet
Legal Stuff:
Options involve risk. Prior to buying or selling an option, an investor must receive a copy of Characteristics and Risks of Standardized Options. Investors need a broker to trade options, and must meet suitability requirements.
The information contained on this site is provided for general informational purposes, as a convenience to the readers. The materials are not a substitute for obtaining professional advice from a qualified person, firm or corporation. Consult the appropriate professional advisor for more complete and current information. I am not engaged in rendering any legal or professional services by placing these general informational materials on this website.
I specifically disclaim any liability, whether based in contract, tort, strict liability or otherwise, for any direct, indirect, incidental, consequential, or special damages arising out of or in any way connected with access to or use of the site, even if I have been advised of the possibility of such damages, including liability in connection with mistakes or omissions in, or delays in transmission of, information to or from the user, interruptions in telecommunications connections to the site or viruses.
I make no representations or warranties about the accuracy or completeness of the information contained on this website. Any links provided to other server sites are offered as a matter of convenience and in no way are meant to imply that I endorse, sponsor, promote or am affiliated with the owners of or participants in those sites, or endorse any information contained on those sites, unless expressly stated.


No comments:
Post a Comment