| Tweet |  |
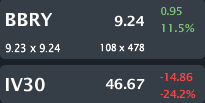
BBRY is trading $9.24, up 11.5% with IV30™ down 24.2%. The Symbol Summary is included below.
Provided by Livevol
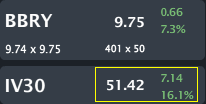
UPDATE: 6-20-2014
Provided by Livevol
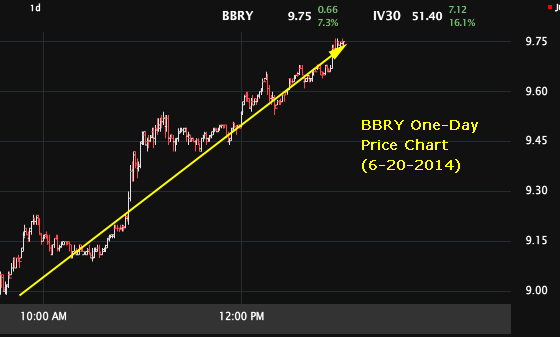
And the intraday stock price chart (6-20-2014)
Provided by Livevol
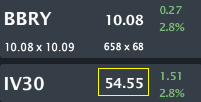
UPDATE: 6-23-2014
Provided by Livevol
And again, BBRY stock is up and the implied volatility is up with the stock. In just a matter of days BBRY has broken through the price range reflected by the option market. And yet again, the option market has proven to be dead wrong, and we have more evidence that the volatility priced into individual names has become absurd.
... back to 6-19-2014
As you will read below, I believe this volatility move is correct and that the option market has been (is) under pricing risk.
I have written quite a bit about BBRY (RIMM at the time), but, really, the history is rather simple if taken as an elevator pitch:
"This used to be the dominant player in handheld cellular devices and messaging and is now, through competition and lack of planning and reaction, on the verge of being irrelevant and insolvent."
Conclusion
BBRY is fighting for its life. Any wrong move now could (and likely will) cause the firm to go bankrupt.
Operating Income has fallen from a profit of $4.6B four-years ago, to a loss of $7.2B. Plain and simple, the company has absolutely imploded. We really don't know what BBRY is worth -- it's a speculation of the present value of future free cash flows and that number could be zero. It could also be quite positive. It could also not matter because of a takeover. So we know nothing, right?
No.. we do know something. We know that we don't know. That's not a play on words, that's the definition of risk for a stock price. But the risk in the stock price per the options is at multi-year lows... and that's... wrong...
Let's start with the news today:
---
NEW YORK (TheStreet) -- Mobile communications provider BlackBerry (BBRY_) shareholders can exhale again after the company's fiscal first-quarter 2015 results improved more than expected.
Investors were expecting another link in a chain of five quarterly losses but instead were greeted with a profit and a reaffirming of guidance.
BlackBerry reported a $23 million GAAP profit, or 4 cents per share. After removing one-time items, the reported net loss was 11 cents per share, markedly better than the 27 cent-per-share loss expected by analysts.
Source: TheStreet.com via Yahoo! Finance BlackBerry Financials Continue to Improve; Shorts Run for Cover
---
So there you have it... a break.. a breath... whatever you want to call it, it wasn't an unmitigated disaster, and that alone is reason for the implied volatility to drop... but to what level.
Let's start with the stock chart all-time.

Provided by Charles Schwab optionsXpress
Well... It went up crazy high... and now it has come down crazy low. Those are technical terms. That chart doesn't clearly show the more recent activity. Check this out:
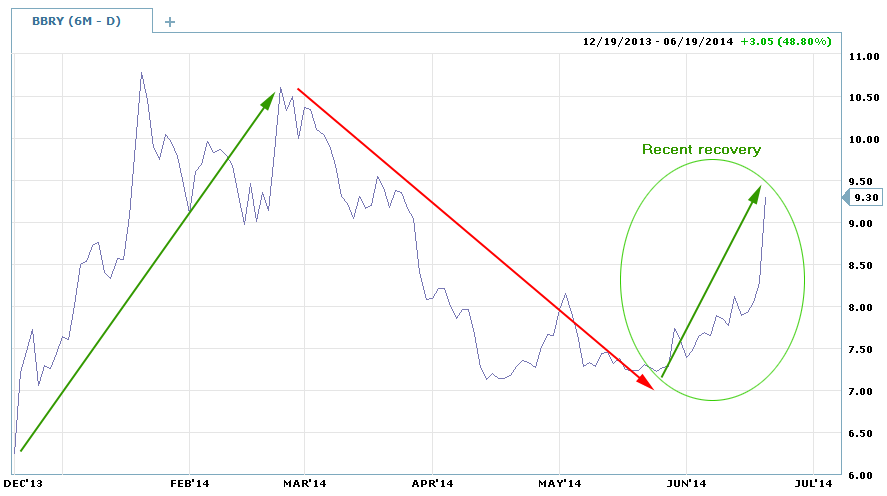
Provided by Charles Schwab optionsXpress
Since 5-23-2014, when the stock closed at $7.23, the stock is up 28%. Now that's a return. My contention is pretty simple, the stock is up rather abruptly of late, was down rather abruptly right before then (see chart above), was up abruptly before that down spell... you get the idea.
We really don't know what BBRY is worth -- it's a speculation of the present value of future free cash flows and that number could be zero. It could also be quite positive. It could also not matter because of a takeover. So we know nothing, right?
No.. we do know something. We know that we don't know. That's not a play on words, that's the definition of risk for a stock price.
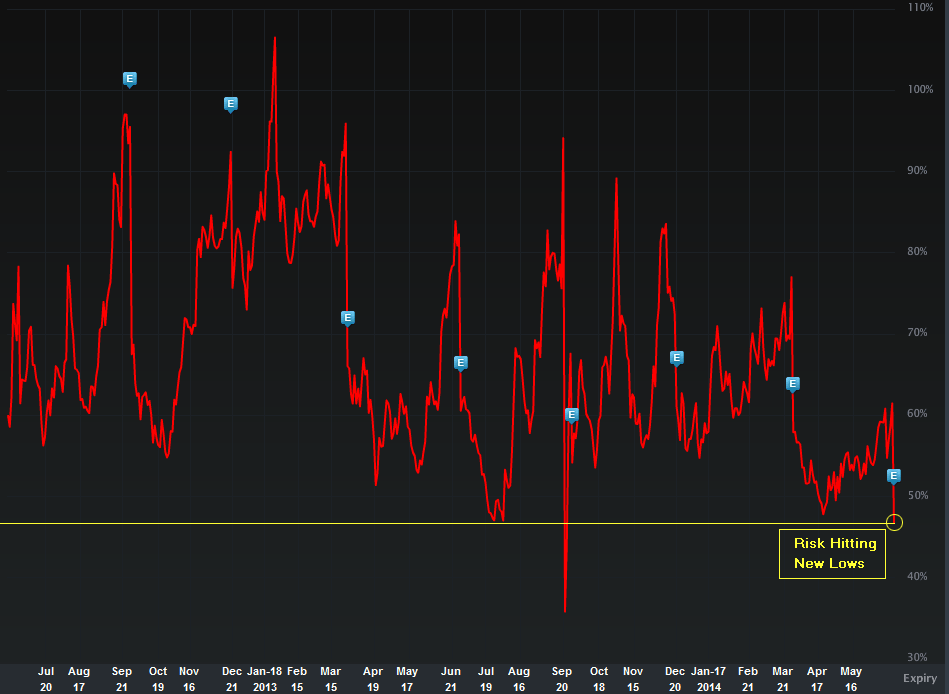
Let's turn to the IV30™ chart in isolation, below.
Provided by Livevol
The implied volatility is the forward looking risk in the equity price as reflected by the option market (IV30™ looks forward exactly 30 calendar days).
So, basically the red curve represents risk. And... why are we now at multi-year lows in risk (other than that one weird spike down, which is likely just a data bug)? The stock chart reads uncertainty, the news (reality) reads uncertainty... but the option market doesn't?
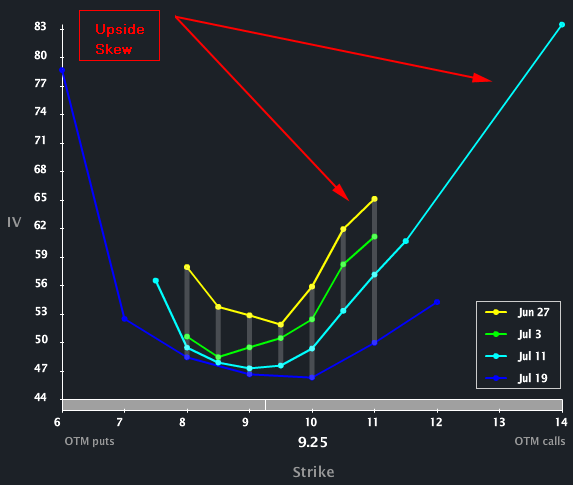
Ah, there is more... The Skew Tab snap (below) illustrates the vols by strike by month.
Provided by Livevol
We can see that for all of the short-term option expires BBRY shows a parabolic skew. In English, in the short-term the option reflects essentially equal probability of a large tail move to the upside or downside. That type of risk is in fact "abnormal." But, not for BBRY.
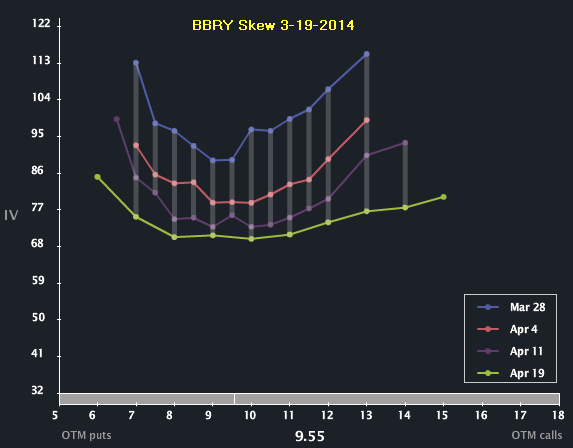
Check out the Skew Tab from exactly three-months ago, below.
Provided by Livevol
Looks the same, right? So, while at an overall level the option market reflects confoundingly low risk, in the short-term, it does reflect continued tail-risk.
To read more about skew, what is and why it exists you can click the title below:
Understanding Option Skew -- What it is and Why it Exists.
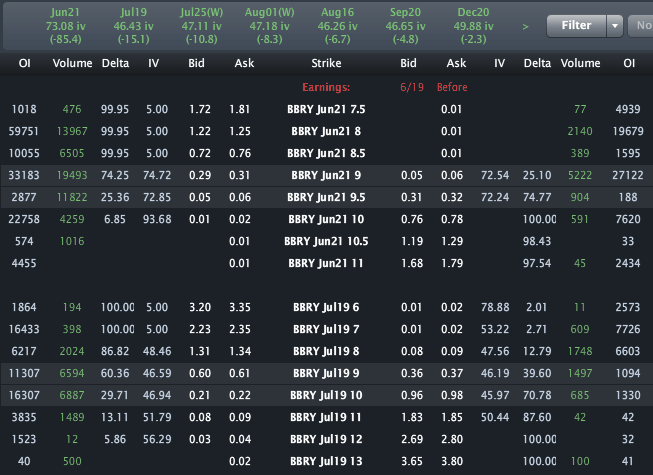
Finally, the Options Tab is included below.
Provided by Livevol
Using the at-the-money (ATM) straddle we can see that the option market reflects a price range of [$8, $10] by the end of trading on July 18th.
- If you believe the stock will be outside that range on expiry or any date before then, then you think the volatility is too low.
- If you believe that range is too wide, and that the stock will definitively be in that range on expiration, then you think volatility is too high.
- If you're not sure, and can make an argument for either case, then you think volatility is priced just about right.
Disclosure: I am long BBRY shares.
This is trade analysis, not a recommendation.
Follow @OphirGottlieb
Tweet
Legal Stuff:
Options involve risk. Prior to buying or selling an option, an investor must receive a copy of Characteristics and Risks of Standardized Options. Investors need a broker to trade options, and must meet suitability requirements.
The information contained on this site is provided for general informational purposes, as a convenience to the readers. The materials are not a substitute for obtaining professional advice from a qualified person, firm or corporation. Consult the appropriate professional advisor for more complete and current information. I am not engaged in rendering any legal or professional services by placing these general informational materials on this website.
I specifically disclaim any liability, whether based in contract, tort, strict liability or otherwise, for any direct, indirect, incidental, consequential, or special damages arising out of or in any way connected with access to or use of the site, even if I have been advised of the possibility of such damages, including liability in connection with mistakes or omissions in, or delays in transmission of, information to or from the user, interruptions in telecommunications connections to the site or viruses.
I make no representations or warranties about the accuracy or completeness of the information contained on this website. Any links provided to other server sites are offered as a matter of convenience and in no way are meant to imply that I endorse, sponsor, promote or am affiliated with the owners of or participants in those sites, or endorse any information contained on those sites, unless expressly stated.


No comments:
Post a Comment