| Tweet |  |
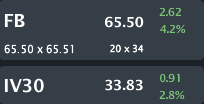
FB is trading $65.50, up 4.2% with IV30™ up 2.8%. The Symbol Summary is included below.
Provided by Livevol
This is a stock and volatility note and what has now become a $168 billion market cap firm. For the record, here is a smattering of firms that FB is now larger than:
- Bank of America (BAC)
- Citigroup(C)
- Intel (INTC)
- Disney (DIS)
- Comcast Corporation (CMCSA)
- Cisco Systems (CSCO)
Conclusion
Through a transformative change in strategy and acquisition the firm has shattered the little box called "social media."
FB is a gigantic, worldwide, super technology firm engaging media, advertising, internet connectivity in remote parts of the Earth, satellites and of course data in ways comparable only to GOOG. Again, we must no longer consider FB "that website where I like my friends." The stock price chart (below) will show you exactly when the world realized this transformation was taking place.
Further, the risk reflected in the stock price by the option market for FB is extremely low relative to FB's past risk premium.
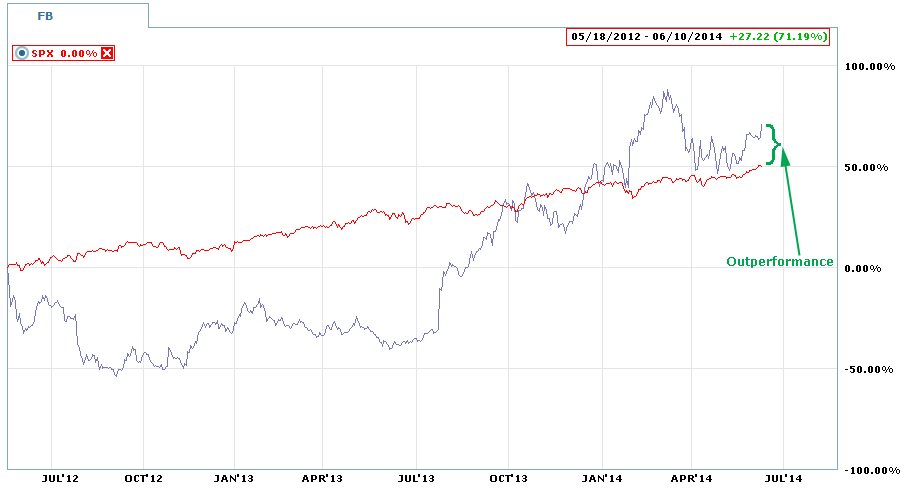
Let's first move to the all-time stock chart for FB (blue) vs. the S&P 500 (red).
Provided by Charles Schwab optionsXpress
It's a rather remarkable chart if we look at the time series. Some facts:
1. The return on FB stock since it's first trade is +71.2%.
2. The return on the SPX in that same time frame is ~50%.
3. The stock was down as much as 52% in its early days of trading.
4. Even with the dip in march/April, the stock return since inception has outpaced the S&P 500 everyday since it crossed the line in Jan 2014.
On the operational side, we can see very clearly that FB the entity is no longer just FB the webpage (or app). Through a change in strategy and acquisition the firm has shattered the little box called "social media."
FB is a gigantic, worldwide, super technology firm engaging media, advertising, internet connectivity, satellites and of course data in ways comparable only to GOOG. Again, we must no longer consider FB "that website where I like my friends."
So that's the operational and stock price part. But there's a "risk" part to this story, and as we all know, I can find no better place to examine risk than the option market.
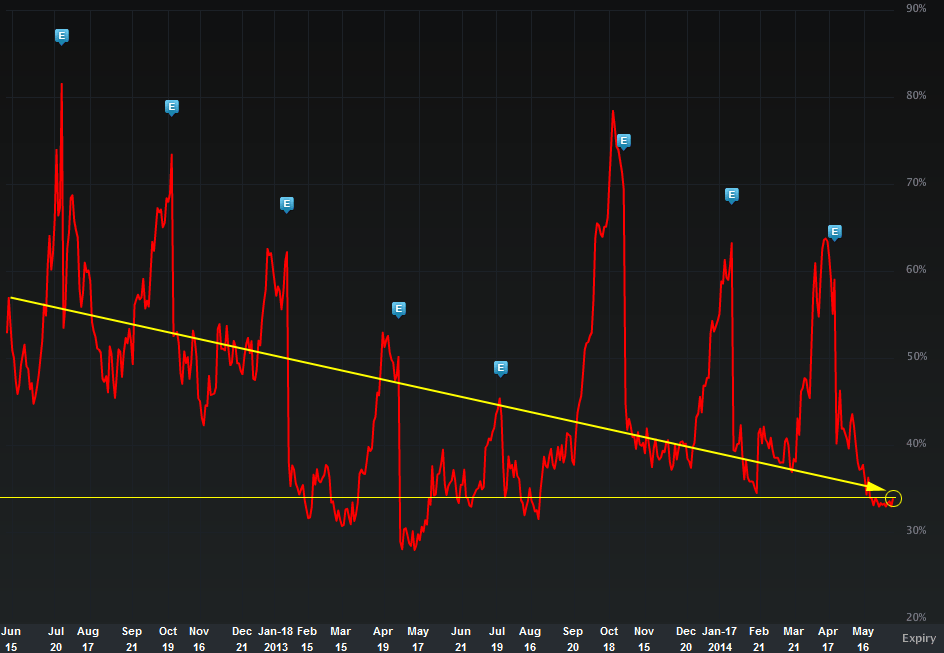
Let's turn to the IV30™ chart in isolation, below.
Provided by Livevol
The implied volatility is the forward looking risk in the equity price as reflected by the option market (IV30™ looks forward exactly 30 calendar days). I note that the level of the implied volatility right now is extremely low relative to the last year. To put it in exact terms, FB IV30™ is in the 5th percentile over the last 52 weeks.
What does that mean? It means if you take the annual high and give it a score of 100, and the annual low and give it a score of 1 to create a 1-100 continuum; FB is 5 right now on that scale. Another way to say it is, the risk reflected in the stock price by the option market for FB is extremely low relative to FB's past risk.
Hmm...
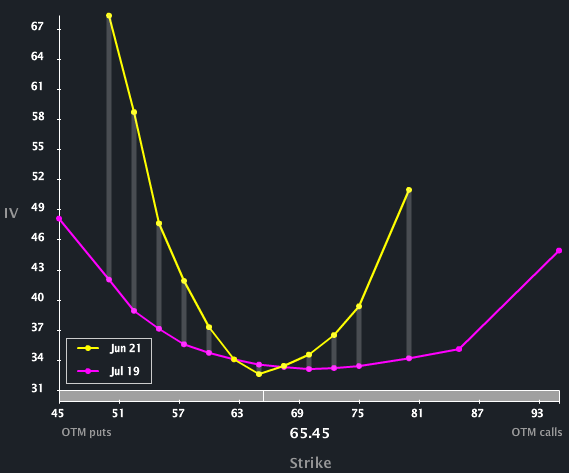
And, there's more to this risk via the option market story. The Skew Tab snap (below) illustrates the vols by strike by month.
Provided by Livevol
I have included the Jun (yellow) and Jul (pink) monthly option expirations. This chart shows the volatility by strike price. The shape of the skew is parabolic (it looks like a 'U'). That shape is a reflection by the option market of elevated tail-risk (big upside or downside stock moves).
The downside tail risk is actually normal. That's how the option market reflects certain realities of stock trading and human kind (see link below for details). The upside skew (the bend to the right hand side of the chart) is unusual or "abnormal."
Try this on for size: The risk as reflected by the option market in FB is very low relative to the past, but the potential for upside moves is now priced as likely as the potential for downside. That's actually bullish for options.
To read more about skew, what is and why it exists you can click the title below:
Understanding Option Skew -- What it is and Why it Exists.
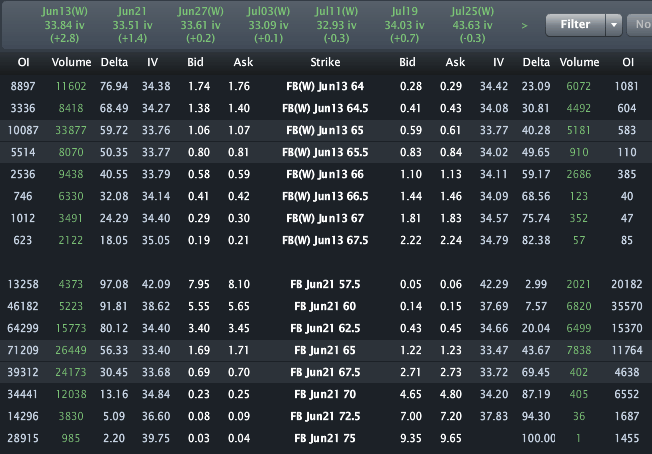
Finally, the Options Tab is included below.
Provided by Livevol
Using the at-the-money (ATM) straddle we can see that the option market reflects a price range of [$62, $68].
- If you believe the stock will be outside that range on expiry or any date before then, then you think the volatility is too low.
- If you believe that range is too wide, and that the stock will definitively be in that range on expiration, then you think volatility is too high.
- If you're not sure, and can make an argument for either case, then you think volatility is priced just about right.
This is trade analysis, not a recommendation.
Follow @OphirGottlieb
Tweet
Legal Stuff:
Options involve risk. Prior to buying or selling an option, an investor must receive a copy of Characteristics and Risks of Standardized Options. Investors need a broker to trade options, and must meet suitability requirements.
The information contained on this site is provided for general informational purposes, as a convenience to the readers. The materials are not a substitute for obtaining professional advice from a qualified person, firm or corporation. Consult the appropriate professional advisor for more complete and current information. I am not engaged in rendering any legal or professional services by placing these general informational materials on this website.
I specifically disclaim any liability, whether based in contract, tort, strict liability or otherwise, for any direct, indirect, incidental, consequential, or special damages arising out of or in any way connected with access to or use of the site, even if I have been advised of the possibility of such damages, including liability in connection with mistakes or omissions in, or delays in transmission of, information to or from the user, interruptions in telecommunications connections to the site or viruses.
I make no representations or warranties about the accuracy or completeness of the information contained on this website. Any links provided to other server sites are offered as a matter of convenience and in no way are meant to imply that I endorse, sponsor, promote or am affiliated with the owners of or participants in those sites, or endorse any information contained on those sites, unless expressly stated.


Are you seeing record low levels of implied vol further out than 30 days as well?
ReplyDeleteIV30: 33.3%
ReplyDeleteIV60: 40.47%
IV90: 40.36%
But, earnings are due out in late July, so that makes the comp NOT apples:apples.