***************************************************
NOTE: The Earnings Preview link is here:
5-12-2014: Plug Power (PLUG) - Earnings Preview & All the Facts. Is the Option Market Under-pricing Risk?
***************************************************
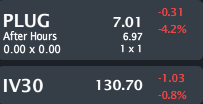
PLUG closed Monday trading at $7.01, down 4.2% with IV30™ down 0.8%. The Symbol Summary is included below.
Provided by Livevol
The news today was this:
---
Fuel cell maker Plug Power Inc. announced Monday that it has signed a non-binding agreement with Hyundai Hysco, a steel supplier to Hyundai Motors, to form a joint venture partnership. Its aim is to develop and market hydrogen fuel cells throughout Asia using Hysco’s advanced stack and plate technology.
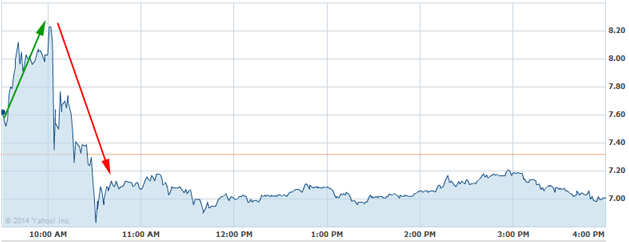
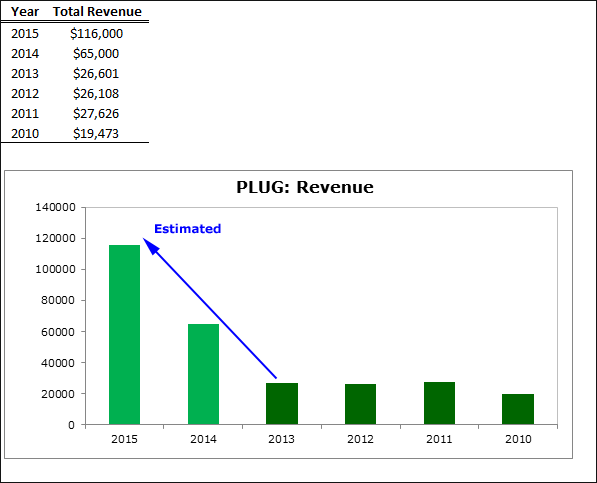
Shares surged more than 10% to $8.23 in early trading. But the stock surrendered those gains in the wake of the morning business update from the CEO that failed to inspire investors. To date, Plug Power has closed nine GenKey deals, totaling almost $80 million in bookings. Plug Power posted 2013 revenues of $26.6 million, and the Thomson Reuters forecast called for sales of $65.0 million in 2014 and $116.3 million in 2015.
Source: Plug Power Shares Drop After Joint Venture News
---
That news was not kindly taken by the market, which was expecting something... better. The one-day stock chart is included below.
Provided by Yahoo! Finance
We can see how the stock rose into the news, then sank after, although it did find a steady state for the rest of the day. After hours trading has the stock at $6.96, so major movement in the after hours session.
But when it comes down to it, this isn't about one day. This is about the phenomenon that is PLUG. A stock that was $0.15 less than two-years ago and hit as high as $11 a few months ago and of course now is at $7. So here are some facts...
1.PLUG has been a publicly traded company for ~15 years. This is not a "new stock."
2. A lot of the excitement however surrounds new technologies, new markets and new technological uses, which may in some sense make PLUG "brand new." Let's turn to the financials, which at a glance, do bear this out.
The first image displays PLUG annual revenues from 2010-2013 and then projections from Reuters for 2014 and 2015.
Provided by NASDAQ; Estimates via Reuters
That jump from 2013-2015 is very exciting. In actual numbers, that's $26 million to $116+ million. But... what about everything else?
Now let's turn to realized operating income from 2010-2013.

Provided by NASDAQ
Not very good, but 2013 is certainly the best of the bunch and growth companies run at losses for substantial periods of time and still see stock appreciation. But... here's where the worry begins.
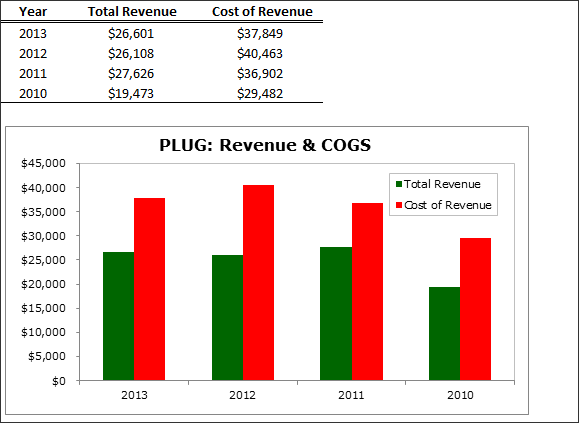
Let's turn to revenues vs. cost of revenues for PLUG, below.
Provided by NASDAQ
Whether you look at the chart or the actual numbers, there is zero evidence that the firm is getting more efficient at production. In fact revenue was higher and cost of revenue were lower in 2011.
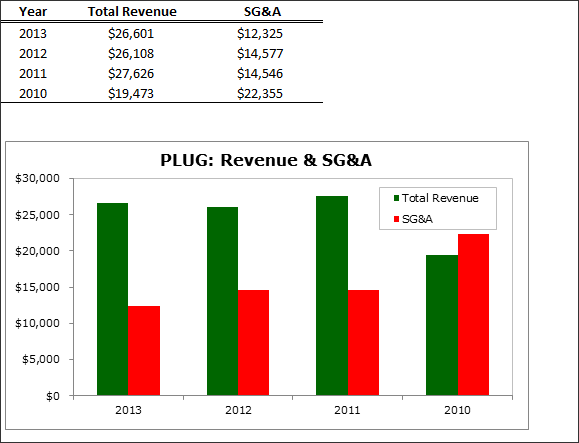
But, there is some operating efficiency. Check out the table and chart of revenue to SG&A (selling, general & administrative costs).
Provided by NASDAQ
There's a chart bulls can get behind. Revenue has been even for 2011-2013, but SG&A has been dropping. That's one source of efficiency. But, what about that operating income chart? Why isn't EBIT rising if SG&A is dropping and COGS are staying constant?
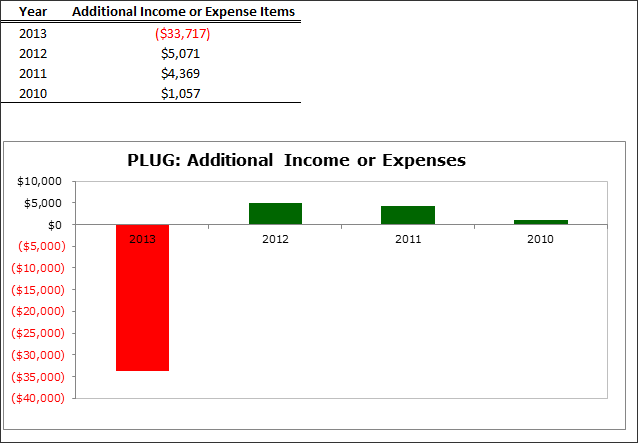
Here's a final chart of "Additional Income or Expense Items."
Provided by NASDAQ
PLUG went from $5M in additional income to now $33.7M in additional expenses. But that's OK, right? The additional expense is due to higher revenue in 2014 and 2015. Or is it?
If revenues are growing from $26M to $65M in one-year ($39M gain), isn't that all but guaranteed to be wiped out with ~$34M in "additional expenses?" Consider that we haven't seen any production efficiency in the financials relative to cost of revenue, that extra revenue just looks more expensive than the prior revenue. I mean, is $10 in revenue worth anything if it costs $11 in expenses?
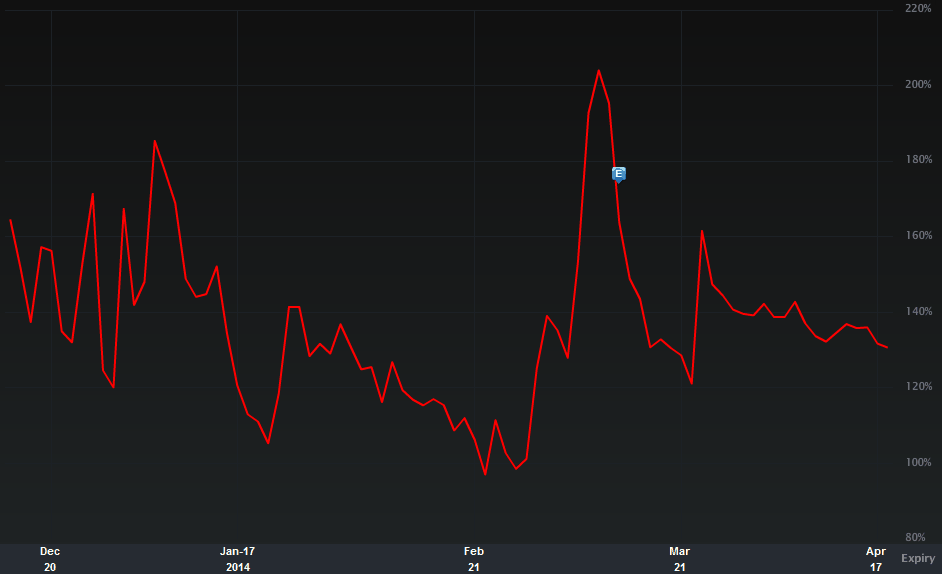
Let's turn to the option market. We know where the stock is, but this is a volatility note, so let's turn to the IV30™ chart in isolation, below.
Provided by Livevol
Right now PLUG is showing sort of "middle of the road" risk based on its recent history. Interesting... But not the end of the story.
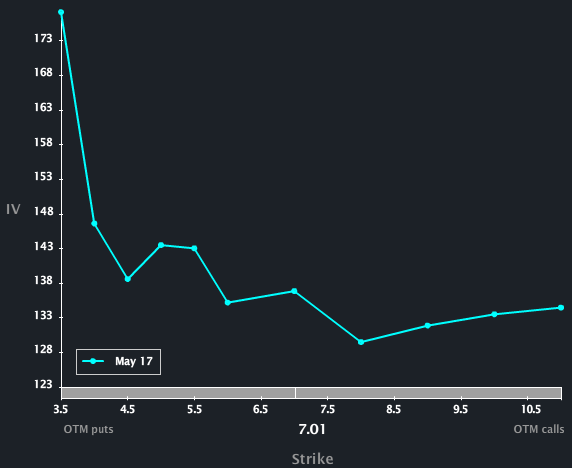
Now let's turn to the Skew Tab.
Provided by Livevol
I find it quite interesting that the skew in PLUG is in fact "normal." With a stock that has moved this much (we're talking about thousands of percentage points), wouldn't you expect parabolic skew?
That is, wouldn't you expect the option market to reflect both upside and downside risk equally?
Well... it doesn't. The upside risk (potential) is not elevated for PLUG. That doesn't mean the option market is right... it just means the option market is... the option market.
To read more about skew, what is and why it exists you can click the title below:
Understanding Option Skew -- What it is and Why it Exists.
Finally, the Options Tab is included below.

Provided by Livevol
Here's where it gets fascinating. While I normally look at short-term options, for this post, let's look long-term. The option market prices the following:
Jan 2016 PLUG will be in the price range [$1.00, $13.00]. Note the low number: $1.00
That leads us to one last piece, and it's rather abrupt. The Jan '16 $1 strike puts closed today with a market of $0.05 x $0.25, or let's say a fair value of $0.15 (slightly less than mid-market). Back of the envelope option trading ("disaster put pricing") tells us:
Likelihood of bankruptcy for PLUG as priced by the option market by 2016 is ~0.15/1.00 = 15%.
Using the $1.5 strike puts ($0.15 x $0.40) the odds of bankruptcy are ~.25/1.5 = 16.7%.
In other words, those two calculations agree. So you tell me, do you think PLUG will be inside those stock price ranges, above those ranges... or... just not around anymore by 2016?
This is trade analysis, not a recommendation.
Follow @OphirGottlieb
Tweet
Legal Stuff:
Options involve risk. Prior to buying or selling an option, an investor must receive a copy of Characteristics and Risks of Standardized Options. Investors need a broker to trade options, and must meet suitability requirements.
The information contained on this site is provided for general informational purposes, as a convenience to the readers. The materials are not a substitute for obtaining professional advice from a qualified person, firm or corporation. Consult the appropriate professional advisor for more complete and current information. I am not engaged in rendering any legal or professional services by placing these general informational materials on this website.
I specifically disclaim any liability, whether based in contract, tort, strict liability or otherwise, for any direct, indirect, incidental, consequential, or special damages arising out of or in any way connected with access to or use of the site, even if I have been advised of the possibility of such damages, including liability in connection with mistakes or omissions in, or delays in transmission of, information to or from the user, interruptions in telecommunications connections to the site or viruses.
I make no representations or warranties about the accuracy or completeness of the information contained on this website. Any links provided to other server sites are offered as a matter of convenience and in no way are meant to imply that I endorse, sponsor, promote or am affiliated with the owners of or participants in those sites, or endorse any information contained on those sites, unless expressly stated.


Your blog deserves to be in my bookmark list.
ReplyDelete