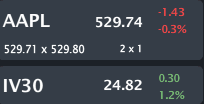
AAPL is trading $529.74, down small with IV30™ up 1.2%. The Symbol Summary is included below.
Provided by Livevol
This is an earnings preview note, and to me, an absolutely astonishing phenomenon has developed in AAPL.
A look backwards: I have written extensively about AAPL. In fact the series below was the most widely read series of blogs I have ever posted over a five year period. Perhaps reading the titles is good enough. For the curious reader the most recent one (at the bottom of the list) does a good job of summarizing the prior ones.
Today, I will be focusing strictly on earnings due out in one day.
12-5-2012
Apple (AAPL) - Have We Moved into a Totally New Volatility Paradigm for This Company? Has Everything Changed?
12-10-2012
Apple (AAPL) - Everything has Changed. The Old AAPL is No More. The New AAPL is a Riskier Entity and the Market Doesn't Know What that Means Yet.
1-23-2013
Apple (AAPL) - "Just the Facts Ma'am" -- Well, that Supports the Opinion: "Everything has Changed. The Old AAPL is No More."
4-18-2013
Apple (AAPL) - This Just Isn't the Company it Used to Be... And it Never Will Be Again.
7-23-2013
Apple (AAPL) - Earnings Preview Reveals Lots of Information; But There is No More 'Old AAPL' -- That's Not Good or Bad... It Just is.
7-29-2013
Apple (AAPL) - Post Earnings Analysis; Risk Paradigm Shift Over; Now the Market Gets It
9-11-2013
Apple (AAPL) - Part 7 (The End): This Just Isn't the Company it Used to Be... And it Never Will Be Again.
TODAY (4-22-2014)
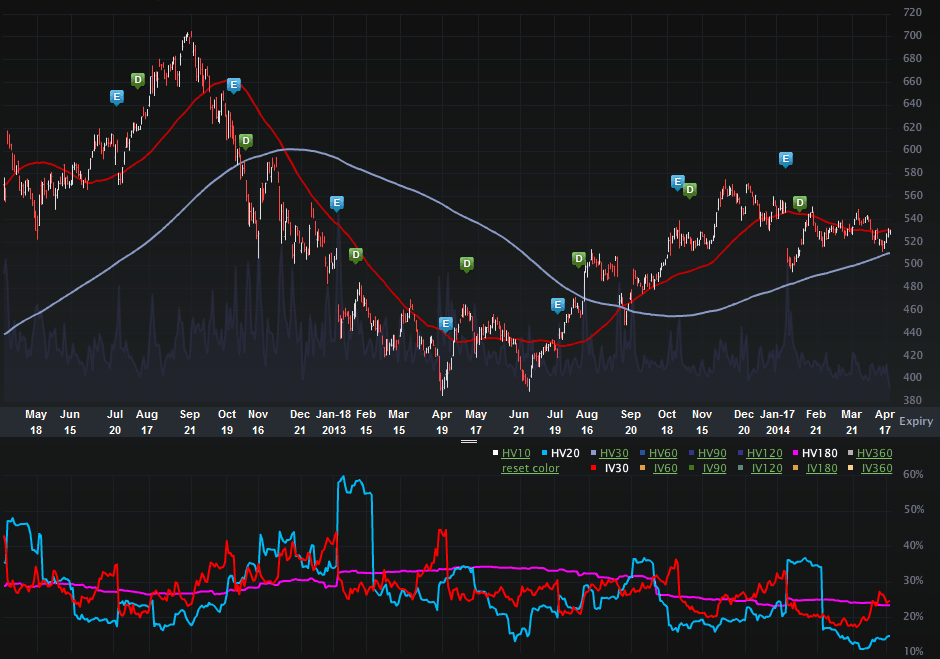
Let's start with the Charts Tab (two-years) is below. The top portion is the stock price, the bottom is the vol (IV30™ - red vs HV20™ - blue vs HV180™ - pink).
Provided by Livevol
So, we all know the stock story. AAPL went from the brink of collapse, to becoming the largest coming in the world (and still is today). The stock price peaked in the $720 range, and Mr. Jobs passed away. The company has literally been stuck in an unshakable range. The firm recently announced a stock buy back that's larger than most of the companies in the S&P 500 ($30 billion buy back against a $28.6 billion median S&P market cap).
But this is all about the volatility into earnings (the risk as reflected by the option market) and it is incredible.
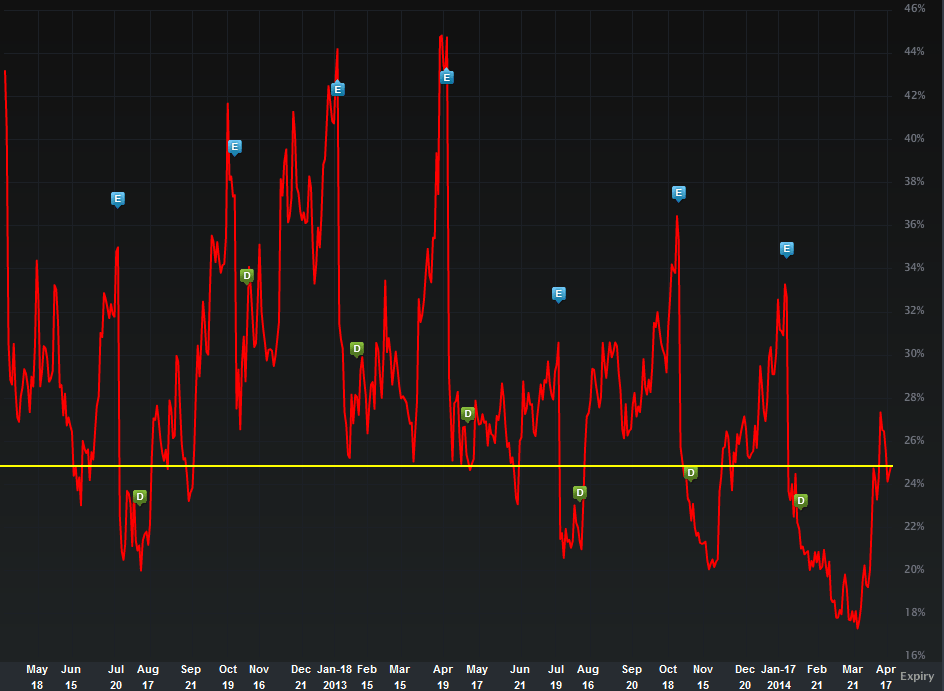
Let's turn to the two-year IV30™ chart in isolation, below.
Provided by Livevol
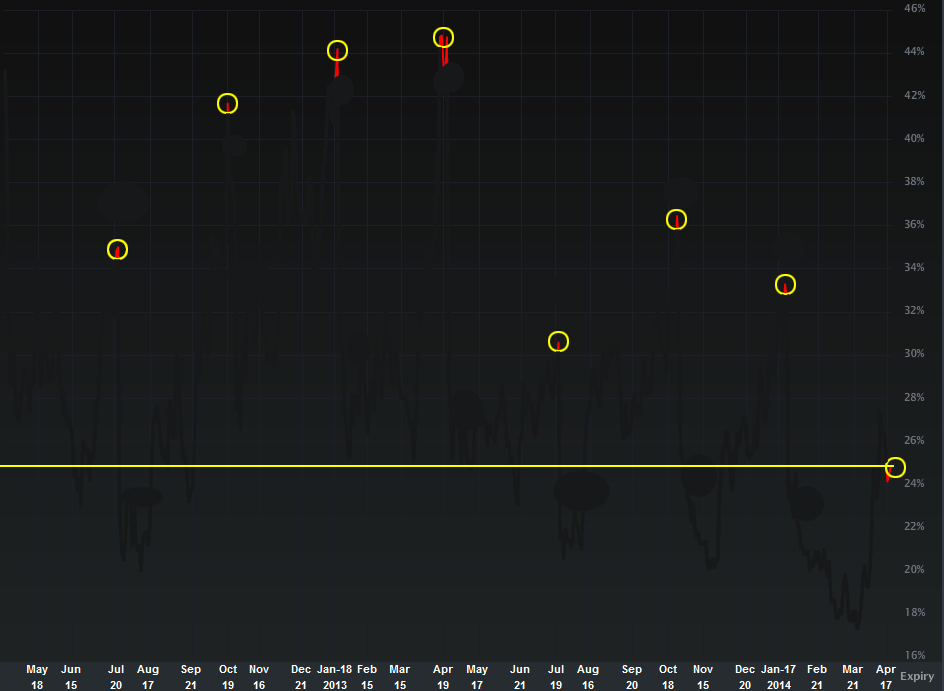
The blue "E" icons represent past earnings dates and I have drawn that yellow horizontal line to show where the current implied volatility lies relative to the history. In fact, let's just look at a cleaner chart below, which only includes the earnings dates.
Provided by Livevol
Now that's easy to see... the risk as reflected by the option market for this earnings release is lower than any prior earnings release in the last two-years. This is a stunning phenomenon to me. But it goes even further...
Even if we include all days in the last year (not just earnings days), the IV30™ (the thirty-day moving average of implied volatility) is in the 27th percentile on an annual basis. In other words, even if this wasn't an earnings date, we would say that the risk in AAPL shares as reflected by the option market is in about the bottom quartile. But this is an earnings event! Stunning...
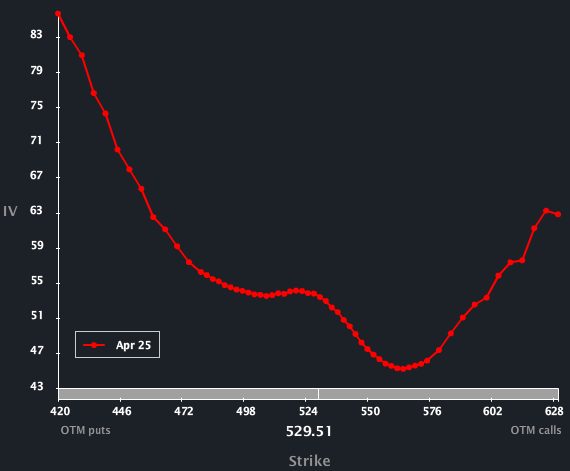
The Skew Tab snap (below) illustrates the vols by strike by month.
Provided by Livevol
We can see parabolic skew in the options which means the option market reflects equal likelihood of a big upside and downside move. this is abnormal skew but actually normal going int earnings.
To read more about skew, what is and why it exists you can click the title below:
Understanding Option Skew -- What it is and Why it Exists.
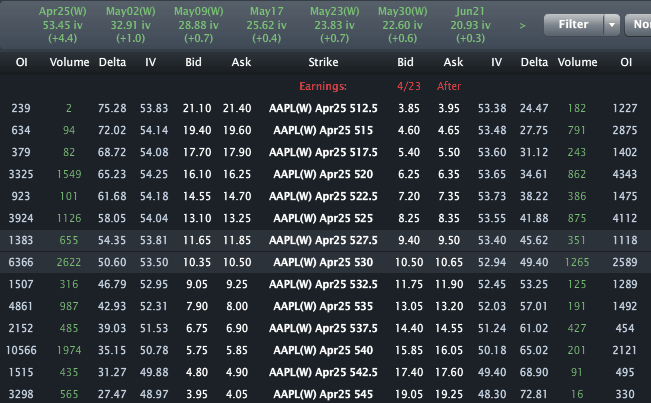
Finally, the Options Tab is included below.
Provided by Livevol
Here we go:
The option market prices a stock price range of: [$508, $552] by the end of this week.
- If you believe the stock will be outside that range on expiry or any date before then, then you think the volatility is too low.
- If you believe that range is too wide, and that the stock will definitively be in that range on expiration, then you think volatility is too high.
- If you're not sure, and can make an argument for either case, then you think volatility is priced just about right.
This is trade analysis, not a recommendation.
Follow @OphirGottlieb
Tweet
Legal Stuff:
Options involve risk. Prior to buying or selling an option, an investor must receive a copy of Characteristics and Risks of Standardized Options. Investors need a broker to trade options, and must meet suitability requirements.
The information contained on this site is provided for general informational purposes, as a convenience to the readers. The materials are not a substitute for obtaining professional advice from a qualified person, firm or corporation. Consult the appropriate professional advisor for more complete and current information. I am not engaged in rendering any legal or professional services by placing these general informational materials on this website.
I specifically disclaim any liability, whether based in contract, tort, strict liability or otherwise, for any direct, indirect, incidental, consequential, or special damages arising out of or in any way connected with access to or use of the site, even if I have been advised of the possibility of such damages, including liability in connection with mistakes or omissions in, or delays in transmission of, information to or from the user, interruptions in telecommunications connections to the site or viruses.
I make no representations or warranties about the accuracy or completeness of the information contained on this website. Any links provided to other server sites are offered as a matter of convenience and in no way are meant to imply that I endorse, sponsor, promote or am affiliated with the owners of or participants in those sites, or endorse any information contained on those sites, unless expressly stated.


The IV in the past 3 months have also been historically low. Could be the emergence of a new paradigm in the options market or the effect of Apple's buyback increasing liquidity and lowering volatility.
ReplyDelete