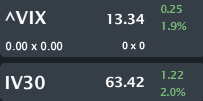
VIX spot is quoting 13.34%, up 1.9% with IV30™ up 2.0%. The Symbol Summary is included below.
Provided by Livevol
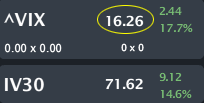
Update 4-10-2104:
Provided by Livevol
I have written extensively on the VIX (who hasn't). In my prior posts I focused not so much on the level of the VIX itself, but rather the level of the implied volatility of the VIX. You can read the prior posts below (part #5 is included below with links to the prior four in the article):
VIX - Part 5: Doomsday/Bubble Scenarios: Its the Volatility of the VIX that's Our Signal; Not the VIX Itself
The title defines my stance, so let's move forward to today and see where the VIX is, and where the implied volatility of the VIX is.
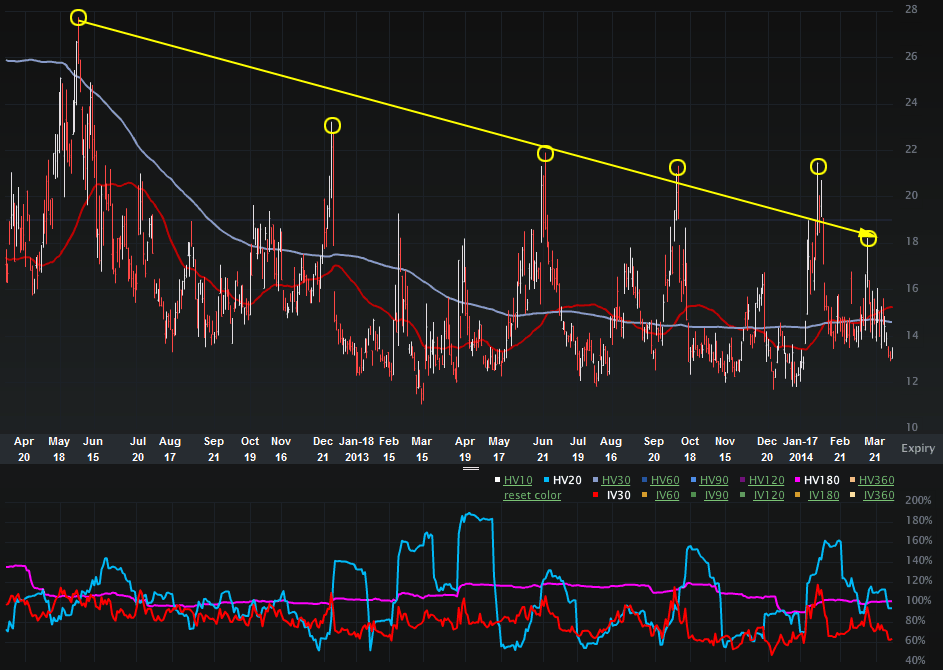
The Charts Tab (two-years) is below. The top portion is the spot price, the bottom is the vol (IV30™ - red vs HV20™ - blue vs HV180™ - pink).
Provided by Livevol
We can see VIX does have this remarkable tendency to spike and then drop, it's almost hypnotic. But note the overall trend of those spikes (I've drawn in that yellow line). Basically, the peaks are lower, reflecting less risk ("fear") in the overall market even as bad news (or "scary" news) comes out.
But, in reality, the risk has been lower -- the US economy, while not at maximum capacity, is doing very well. Unemployment is down, GDP is up, corporate profits (ex-weather) are up. Yeah, less risk... Right?...
There are global concerns though too. Like that one country, what do they call it?... "China." For more of a macro-economic view of the global markets (and the US) I do highly recommend reading this recent post:
Is the US in a Bubble? Absolutely Definitive Charts That Will Tell You... Whatever You Want to Believe
But, ultimately, when I turn to the volatility of the VIX, I see something that does raise an eyebrow... actually, both eyebrows.
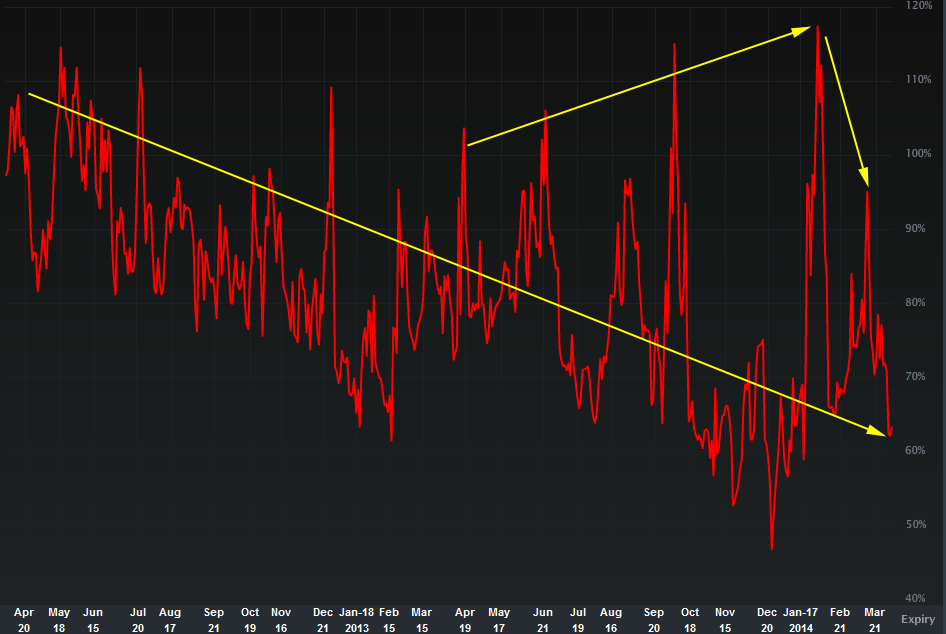
Let's turn to the IV30™ chart in isolation, below (same two-year period).
Provided by Livevol
A few phenomena to note:
1. The general trend in the 30-day implied volatility of the VIX has been down (that diagonal yellow line in the middle).
2. The peaks in the IV30 of the VIX were rising up until the very recent past. You can see that in the first diagonal yellow line at the top that I drew above.
3. But... the most recent peak was substantially lower than the peak(s) before it.
OK, enough chart talk... Here's the point. The vol of VIX is low relative to the last two-years, but not relative to the last six-months (sort of, middle-of-the road). But, the fact that the last peak was so low relative to the past gives me pause for thought... and a conclusion...
There's more risk in the market than VIX and the vol of VIX are reflecting. That's my opinion and yes, I do own call spreads in VIX.
Finally, the Options Tab is included below.
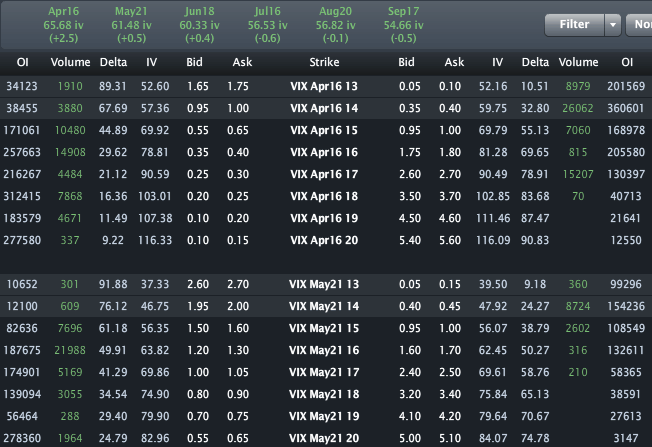
Provided by Livevol
Just check out the levels right now, and let's see how those May options look in a month (or whatever).
This is trade analysis, not a recommendation.
Follow @OphirGottlieb
Tweet
Legal Stuff:
Options involve risk. Prior to buying or selling an option, an investor must receive a copy of Characteristics and Risks of Standardized Options. Investors need a broker to trade options, and must meet suitability requirements.
The information contained on this site is provided for general informational purposes, as a convenience to the readers. The materials are not a substitute for obtaining professional advice from a qualified person, firm or corporation. Consult the appropriate professional advisor for more complete and current information. I am not engaged in rendering any legal or professional services by placing these general informational materials on this website.
I specifically disclaim any liability, whether based in contract, tort, strict liability or otherwise, for any direct, indirect, incidental, consequential, or special damages arising out of or in any way connected with access to or use of the site, even if I have been advised of the possibility of such damages, including liability in connection with mistakes or omissions in, or delays in transmission of, information to or from the user, interruptions in telecommunications connections to the site or viruses.
I make no representations or warranties about the accuracy or completeness of the information contained on this website. Any links provided to other server sites are offered as a matter of convenience and in no way are meant to imply that I endorse, sponsor, promote or am affiliated with the owners of or participants in those sites, or endorse any information contained on those sites, unless expressly stated.


Ophir,
ReplyDeleteWhy VIX call spreads versus being long VIX calls
VIX call spreads allow me to sell higher vol than I purchase (VIX has reverse skew) and a hedge. I think momentum stocks are going down, SPX may hold up relatively.
ReplyDelete