


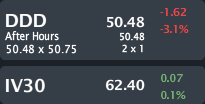
DDD closed Wednesday trading at $50.48, down 3.1% with IV30™ up 0.1%. The Symbol Summary is included below.
Provided by Livevol
For those that don't know: The Company is a provider of three-dimensional (3D) content-to-print solutions including 3D printers, print materials and on-demand custom parts services for professionals and consumers.
3-D printing is an amazing technology, and if you haven't heard of it before, please do Google it. It's rather remarkable.
Prior earnings notes:
4-22-2014
Facebook (FB): Earnings Preview: Option Market Reads: "Oh, yeah, that's happening..."
4-22-2014
Apple (AAPL) - Earnings Preview: An Astonishing and Unprecedented Phenomenon is Happening Right Now.
4-20-2014
Microsoft (MSFT) - Earnings Preview: Cash Rich, Dividend Payer, Stock Up 50%... What Now?
4-17-2014
Netflix (NFLX) - Earnings Preview: My Bologna Has a First Name: c.o.m.p.e.t.i.t.i.o.n.; A Reckoning is Coming with Earnings.
4-16-2014
Illumina (ILMN) - Volatility Explodes to Multi-year Highs Ahead of Earnings. Skew Reverse; Bends Backwards.
4-15-2014
Google (GOOG) - Earnings Preview: Highest Risk in Nearly 2-years. A Market Moving Event.
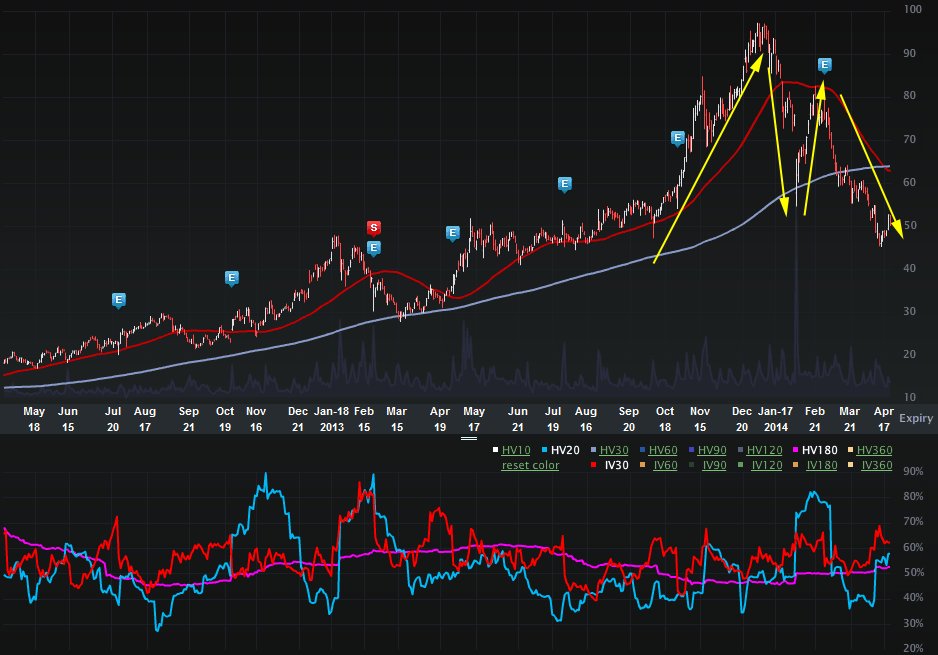
But this is a specific pre-earnings note on DDD, one of the leaders in the industry. Let's start with the Charts Tab (two-years), below. The top portion is the stock price, the bottom is the vol (IV30™ - red vs HV20™ - blue vs HV180™ - pink).
Provided by Livevol
So this is the deal with the 3-D world. The stock prices were exploding... For some stocks we saw gains in the thousands of %. DDD was trading at $18.98 two years ago and hit as high as $97.28. It has also seen that abrupt correction down to $50. Oddly, during that time of stock drop, there was an abrupt rise from $64 to $82 in just two weeks, but oh my how things turned again.
When investors refer to the momentum stock bubble, 3-D stocks and biotechs were two of the most noted industries.
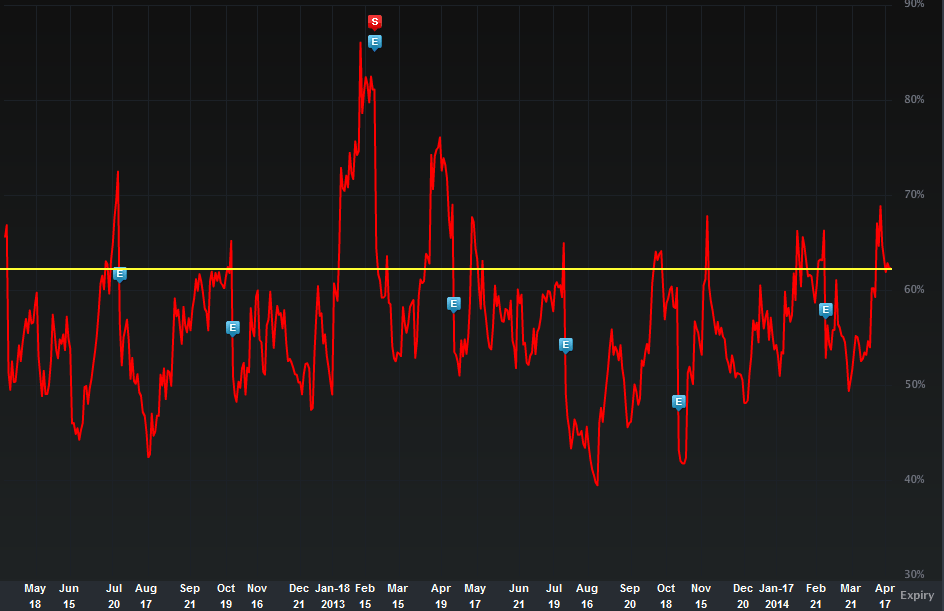
But this is an earnings note, so let's turn to the IV30™ chart in isolation, below (same two-year time period).
Provided by Livevol
I've drawn that yellow horizontal line in there to make it easier to see where the current level of the implied is relative to the last two-years. On an annual level, DDD's IV30™ is in the 68th percentile (so, high"ish"). Given that earnings are due out before the open on 4-29-2014, we would expect vol to be elevated.
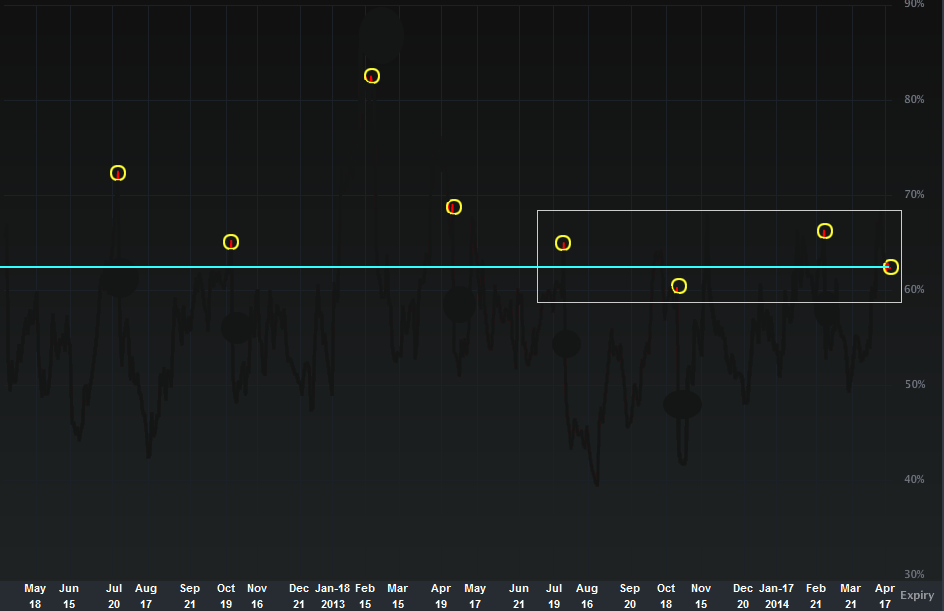
Let's look more closely at DDD vol relative to the last seven earnings cycles using the same chart, but only focusing on those event dates.
Provided by Livevol
I note that the current level of the volatility is very similar to the prior three earnings cycles (I boxed them in grey). So, the option market reflects very similar risk right now in DDD earnings as it has in the last year. The question becomes, "is there very similar risk right now in DDD earnings as it there has been in the last year?"
I don't know, really... The option market has been pricing low volatility in a number of names (FB, AAPL, NFLX) and sometimes it has been right (NFLX) and sometimes it has been dead wrong (AAPL). I think DDD vol may be too low, but we'll put some actual numbers to it in a sec. First...
The Skew Tab snap (below) illustrates the vols by strike.
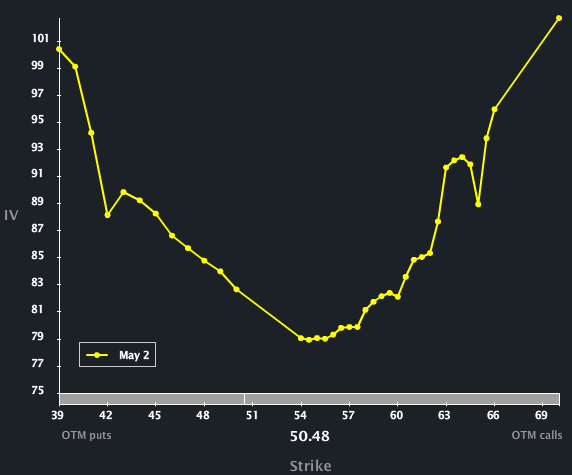
Provided by Livevol
I note a parabolic skew for DDD - this is abnormal without earnings, but very normal when we approach earnings. I would say of all things, the skew in DDD looks perfectly shaped, reflecting equal likelihood of tail risk to the upside and downside.
To read more about skew, what is and why it exists you can click the title below:
Understanding Option Skew -- What it is and Why it Exists.
Finally, the Options Tab is included below.
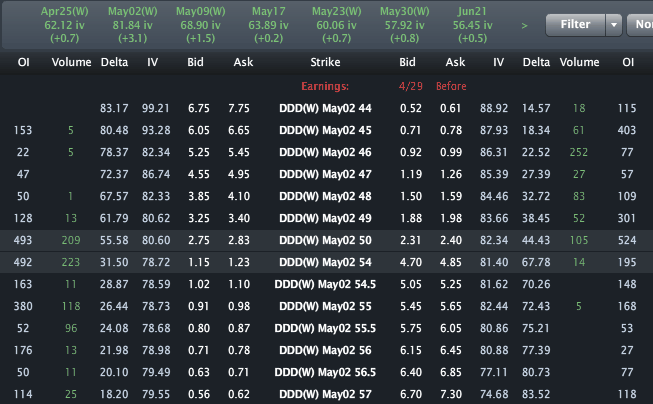
Provided by Livevol
As of right now, the option market prices a range of [~$45, ~$55] by expiration on May 2nd.
- If you believe the stock will be outside that range on expiry or any date before then, then you think the volatility is too low.
- If you believe that range is too wide, and that the stock will definitively be in that range on expiration, then you think volatility is too high.
- If you're not sure, and can make an argument for either case, then you think volatility is priced just about right.
I think that vol feels low... Not crazy low, but.. ya know... not high. Please DON'T make a trade on my opinion. This is trade analysis, not a recommendation.
Follow @OphirGottlieb
Tweet
Legal Stuff:
Options involve risk. Prior to buying or selling an option, an investor must receive a copy of Characteristics and Risks of Standardized Options. Investors need a broker to trade options, and must meet suitability requirements.
The information contained on this site is provided for general informational purposes, as a convenience to the readers. The materials are not a substitute for obtaining professional advice from a qualified person, firm or corporation. Consult the appropriate professional advisor for more complete and current information. I am not engaged in rendering any legal or professional services by placing these general informational materials on this website.
I specifically disclaim any liability, whether based in contract, tort, strict liability or otherwise, for any direct, indirect, incidental, consequential, or special damages arising out of or in any way connected with access to or use of the site, even if I have been advised of the possibility of such damages, including liability in connection with mistakes or omissions in, or delays in transmission of, information to or from the user, interruptions in telecommunications connections to the site or viruses.
I make no representations or warranties about the accuracy or completeness of the information contained on this website. Any links provided to other server sites are offered as a matter of convenience and in no way are meant to imply that I endorse, sponsor, promote or am affiliated with the owners of or participants in those sites, or endorse any information contained on those sites, unless expressly stated.
No comments:
Post a Comment