NFLX is trading $358.18, up 1.8% with IV30™ down 6.8%. The Symbol Summary is included below.
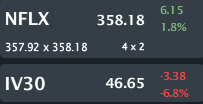
Provided by Livevol
TSLA is trading $213.24, up 2.3% with IV30™ down 2.9%. The Symbol Summary is included below.
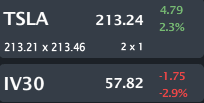
Provided by Livevol
This is a follow up note to two separate articles I posted on NFLX and TSLA and in general the momentum stock bubble (as I see it) and that it is deflating right now. You can read either of those notes by clicking on the links below:
3-24-2014: Netflix (NFLX) - How the Option Market Totally Blew It... And We Knew it a Month Ago. Momentum Stocks are Deflating... Right Now.
3-27-2014: Tesla Motors (TSLA) - Risk Profile Changes; Momentum Stocks are Deflating... Right Now.
The main takeaways from those articles are included below (allow myself to introduce... myself..):
---
I have written extensively about NFLX, almost compulsively. I love the company and I love the management. Their turnaround has been one of the most unbelievable success stories I have ever seen. In fact, I published a final note in a long series on 9-10-2013. That note is included below:
9-10-2013: Netflix (NFLX) - Is this the Most Powerful Firm in Entertainment? Some Things I Bet You Didn't Know... But Want to.
I say all of that, because what I'm about to say is not about the company or the management, it's about that thing we call a stock price. In my opinion, on March 11 2014, the momentum (or 'MOMO') stock bubble began to deflate and it will continue to deflate a rather large amount in the next six months.
On 3-11-2014, I tweeted:
"Profit-taking drags Wall Street lower." via @Reuters --- I don't think it was profit taking... March 11th 2014.
— Ophir Gottlieb (@OphirGottlieb) March 12, 2014
I wrote a note on the US Bubble (if there is one or not). You can read that note here:Is the US in a Bubble? Absolutely Definitive Charts That Will Tell You... Whatever You Want to Believe
So, while this note will focus on NFLX, it is really meant simply as a case study on the rest of the momentum stocks. For anyone reading that has a personal connection to these stocks, please save the hate mail and hate tweets, this is my forum, this is my opinion, if you disagree, just don't read it. I respect that decision. Please respect mine. I have no ax to grind; don't give me one.
On Feb 13th, I wrote rather loudly that the volatility in NFLX was simply wrong. It was way too low, and it had been for far too long. That post in included below:
2-13-2014: Netflix (NFLX) - Unprecedented Low Risk?... How Many Times Will the Option Market Prove Wrong? And is it Right This Time?
---
OK, enough chest pounding, let's look at NFLX and TSLA right now. The Charts Tab (six-months) is below. NFLX is in red, TSLA is in yellow and the chart is in return (not dollars).

Provided by Livevol
I note three phenomena:
1. Obviously the charts start at 0% and interestingly, they end at the same point. Both are up ~10% in six-months.
2. The two stocks took totally different trajectories. NFLX (red curve) has been positive for essentially the entire time period, while TSLA (yellow curve) was negative for the majority of the time period.
3. Most important to this post, note the abrupt rise and now abrupt fall in the last month. I've highlighted that with the blue arrows.
The question that I want to address is whether or not that drop is just a bump in the road / profit taking, or an actual change in trend that does in fact signal (reflect) a deflation of the momentum stocks. I believe it's a change in paradigm, it could be a bear trap as well; time will tell. But, there are more similarities between these firms and it's the similarities that have me worried.
Let's turn to the IV30™ chart in isolation, below for the same six-month time frame. Once again, NFLX is the red curve and TSLA is the yellow curve.
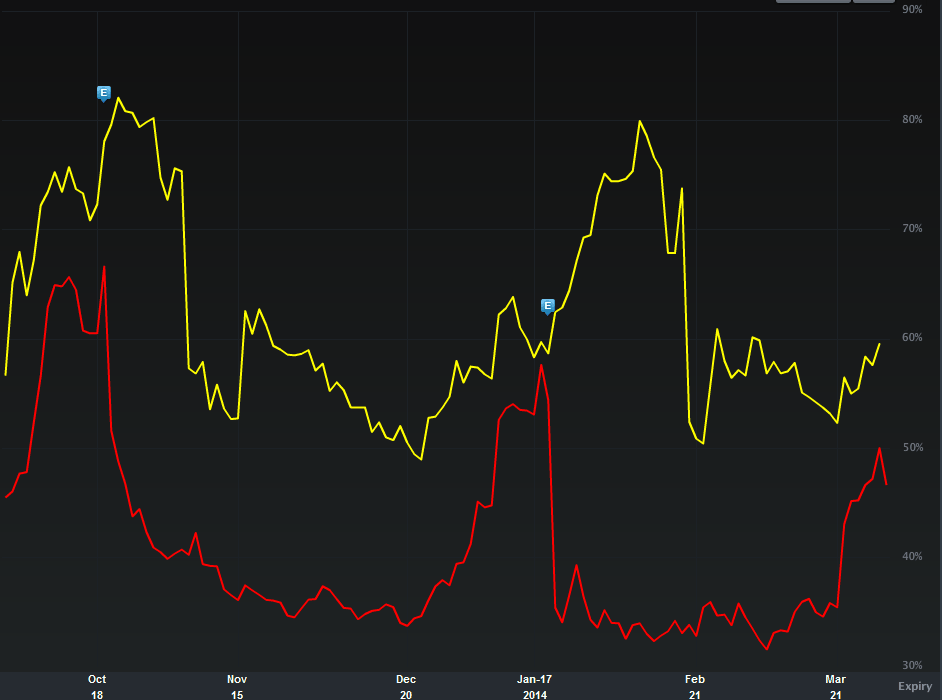
Provided by Livevol
We can see:
1. NFLX volatility is always lower than TSLA for the last six-months. Note that at the lows for NFLX vol, I wrote that post that the options had mis-priced the risk.
2. For all the ups and downs, yet again, just like the stock return, the volatilities are converging (ish).
When stock prices move together with a high degree of similarity people refer to it as high correlation. This is common among companies in the same industry, but NFLX and TSLA are nowhere near the same industry. They are however both large cap momentum stocks.
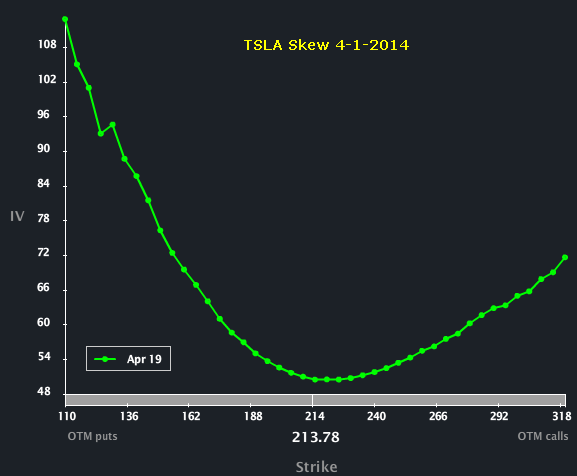
The similarities also exist in the depths of option trading, i.e. the skew. The Skew Tab snaps (below) illustrate the vols by strike for NFLX and TSLA.
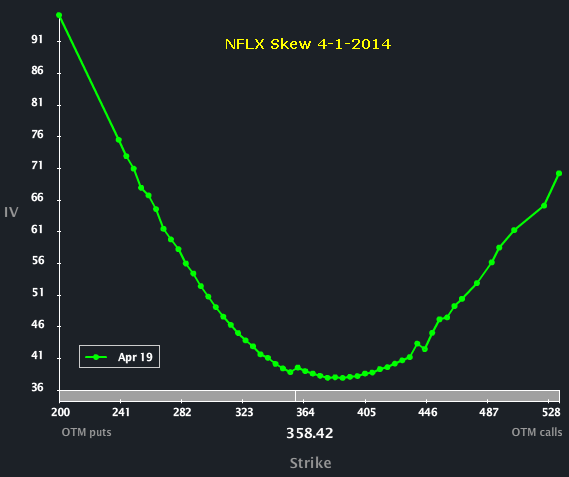
Provided by Livevol
Provided by Livevol
Note how they are both parabolic, and frighteningly similarly parabolic. The option market reflects equal two-tail risk (up and down). That skew shape is in fact "abnormal."
To read more about skew, what is and why it exists you can click the title below:
Understanding Option Skew -- What it is and Why it Exists.
But what we find now are these momentum stocks with eerily similar returns over the last six months, eerily similar drops over the last month, eerily similar volatilities and skews.
So what?
When this many measures of return and risk are so similar in two totally different industries, we are moving away from "company by company" valuation and much more into "trend" valuation. There is no (or very little) diversification benefit when invested in the MOMO stocks. When that happens, we're either in a rip roaring boom or... the beginning of not that...
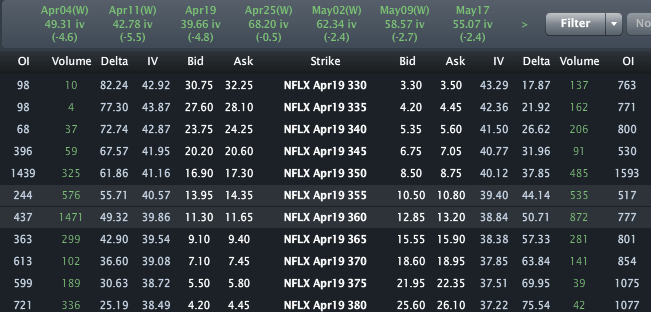
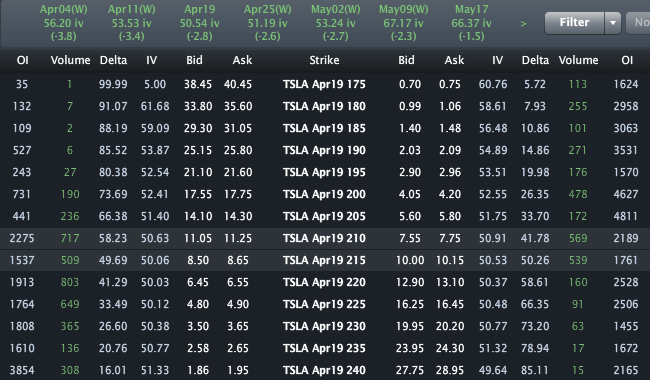
Finally, the Options Tab for both is included below.
Provided by Livevol
Provided by Livevol
The option market reflects the following price ranges for these two stocks by the end of Apr expiry (Apr 18th):
NFLX: [$336, $384] (using the $360 strike straddle)
TSLA: [$196.50, $233.50] (using the $215 strike straddle)
Again... we'll see.
This is trade analysis, not a recommendation.
Follow @OphirGottlieb
Tweet
Legal Stuff:
Options involve risk. Prior to buying or selling an option, an investor must receive a copy of Characteristics and Risks of Standardized Options. Investors need a broker to trade options, and must meet suitability requirements.
The information contained on this site is provided for general informational purposes, as a convenience to the readers. The materials are not a substitute for obtaining professional advice from a qualified person, firm or corporation. Consult the appropriate professional advisor for more complete and current information. I am not engaged in rendering any legal or professional services by placing these general informational materials on this website.
I specifically disclaim any liability, whether based in contract, tort, strict liability or otherwise, for any direct, indirect, incidental, consequential, or special damages arising out of or in any way connected with access to or use of the site, even if I have been advised of the possibility of such damages, including liability in connection with mistakes or omissions in, or delays in transmission of, information to or from the user, interruptions in telecommunications connections to the site or viruses.
I make no representations or warranties about the accuracy or completeness of the information contained on this website. Any links provided to other server sites are offered as a matter of convenience and in no way are meant to imply that I endorse, sponsor, promote or am affiliated with the owners of or participants in those sites, or endorse any information contained on those sites, unless expressly stated.


No comments:
Post a Comment