Wednesday, April 30, 2014

04-30-14: End of Day Report - Largest Stock Moves, New 52 Wk. Highs/Lows, Unusual Option Volume


Top Headlines
Dow closes at record, notches monthly gain

Fed continues to taper, looking past weak first quarter

Never mind the recovery, get ready for the next recession

Top option Story
Tesla Motors (TSLA) - Earnings Preview; How The Last Two Abrupt Earnings Moves Look to Today's Risk

Open Interest
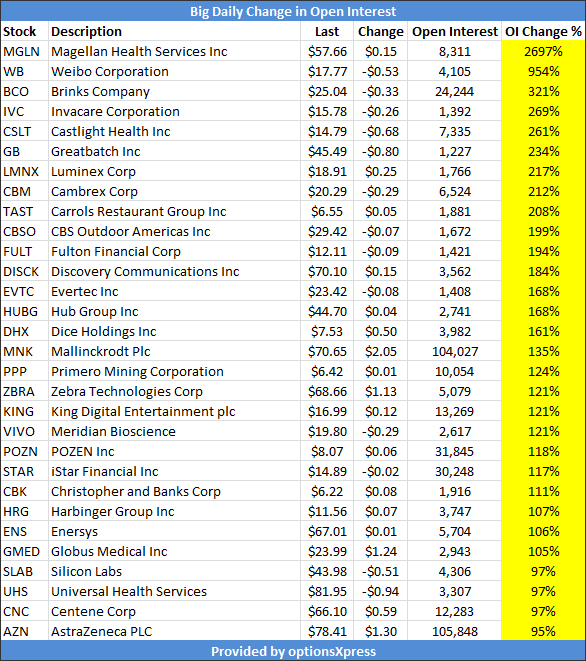
4-30-2014: Open Interest Report

Biotech Index
Daily Biotech Small & Micro Cap Update

Market Overview

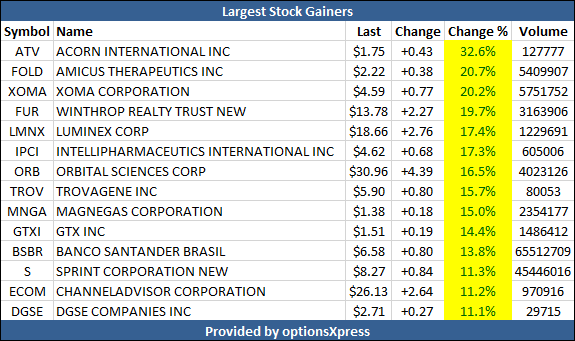
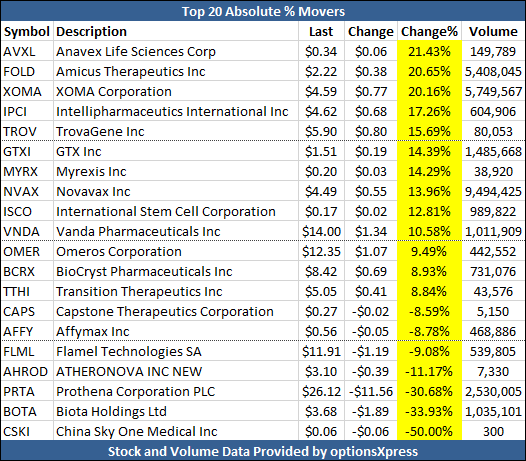
Largest Stock Gainers


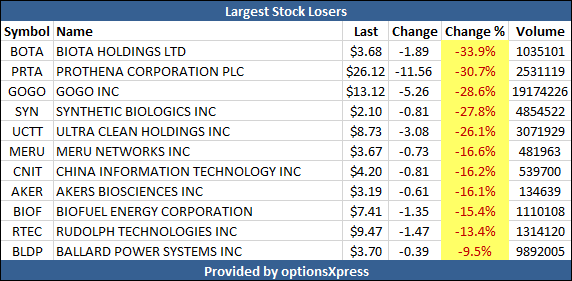
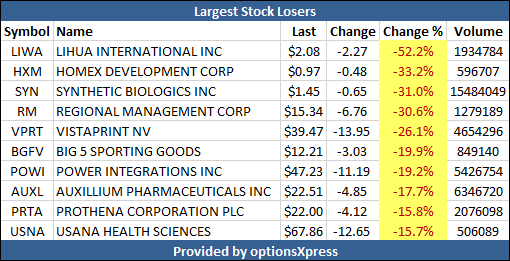
Largest Stock Losers


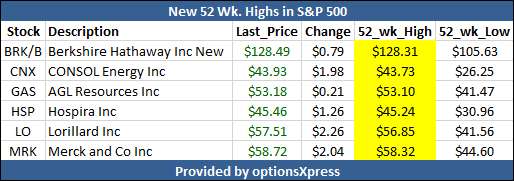
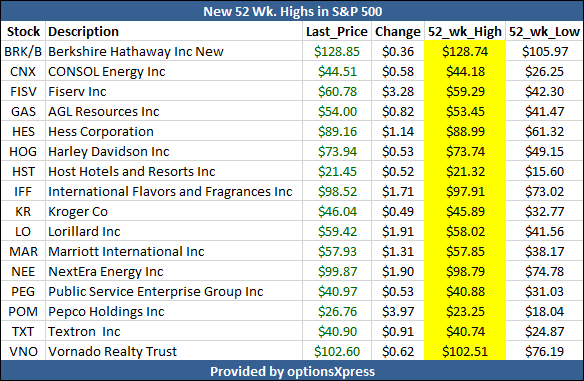
New 52 Wk Highs in S&P 500


New 52 Wk Lows in S&P 500
No New Lows


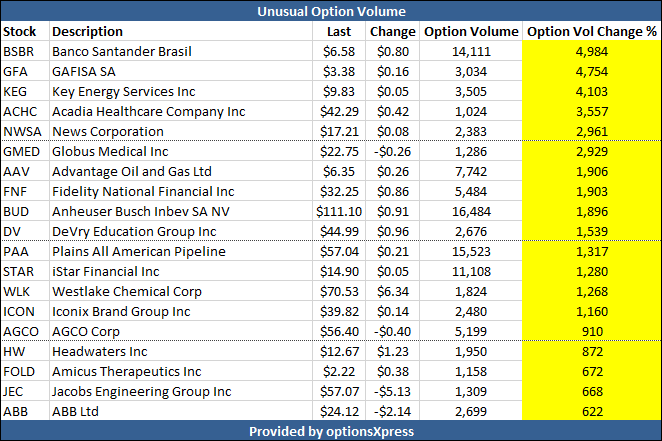
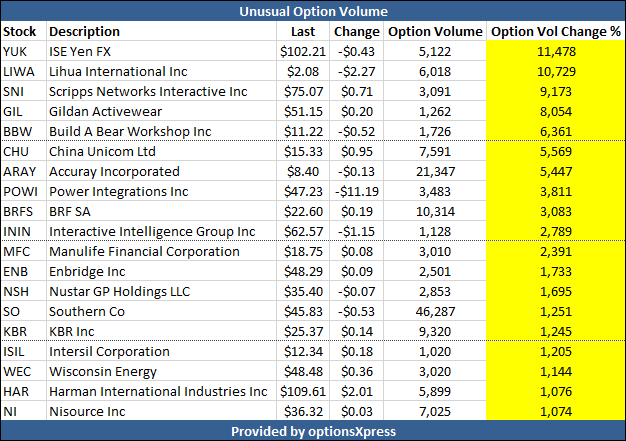
Unusual Option Volume


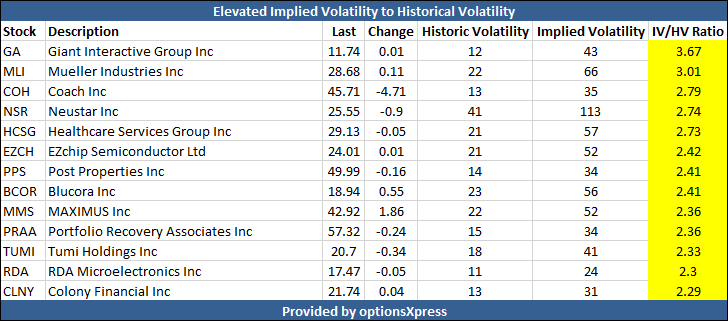
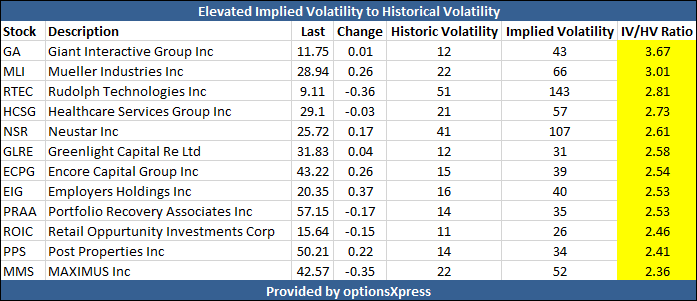
Elevated Implied Volatility (IV) to Historical Volatility (HV)


This is trade analysis, not a recommendation.


Legal Stuff:
Options involve risk. Prior to buying or selling an option, an investor must receive a copy of Characteristics and Risks of Standardized Options. Investors need a broker to trade options, and must meet suitability requirements.

The information contained on this site is provided for general informational purposes, as a convenience to the readers. The materials are not a substitute for obtaining professional advice from a qualified person, firm or corporation. Consult the appropriate professional advisor for more complete and current information. I am not engaged in rendering any legal or professional services by placing these general informational materials on this website.

I specifically disclaim any liability, whether based in contract, tort, strict liability or otherwise, for any direct, indirect, incidental, consequential, or special damages arising out of or in any way connected with access to or use of the site, even if I have been advised of the possibility of such damages, including liability in connection with mistakes or omissions in, or delays in transmission of, information to or from the user, interruptions in telecommunications connections to the site or viruses.

I make no representations or warranties about the accuracy or completeness of the information contained on this website. Any links provided to other server sites are offered as a matter of convenience and in no way are meant to imply that I endorse, sponsor, promote or am affiliated with the owners of or participants in those sites, or endorse any information contained on those sites, unless expressly stated.

Daily Biotech Small & Micro Cap Update


The Ophir Gottlieb Small Cap Biotech Index
Is this the biotech revolution or the biotech bust?


231 small / micro cap biotech and pharma companies (equal weighted):
  • Public Biotech and Pharma Companies
  • Trade on North American Exchanges
  • Market Cap Range: [$0, $2 Billion]
  • Price, Employees, Revenue Range: Any
More on index construction and performance: The Ophir Gottlieb Small Cap Biotech Index

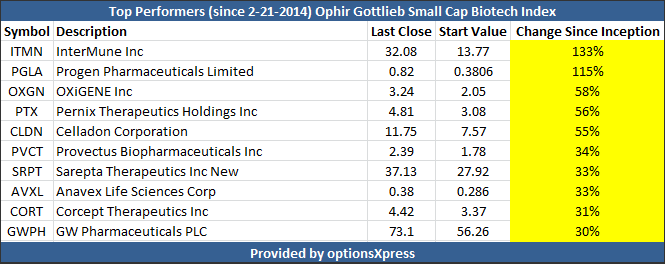
Biotech stocks up 30%+


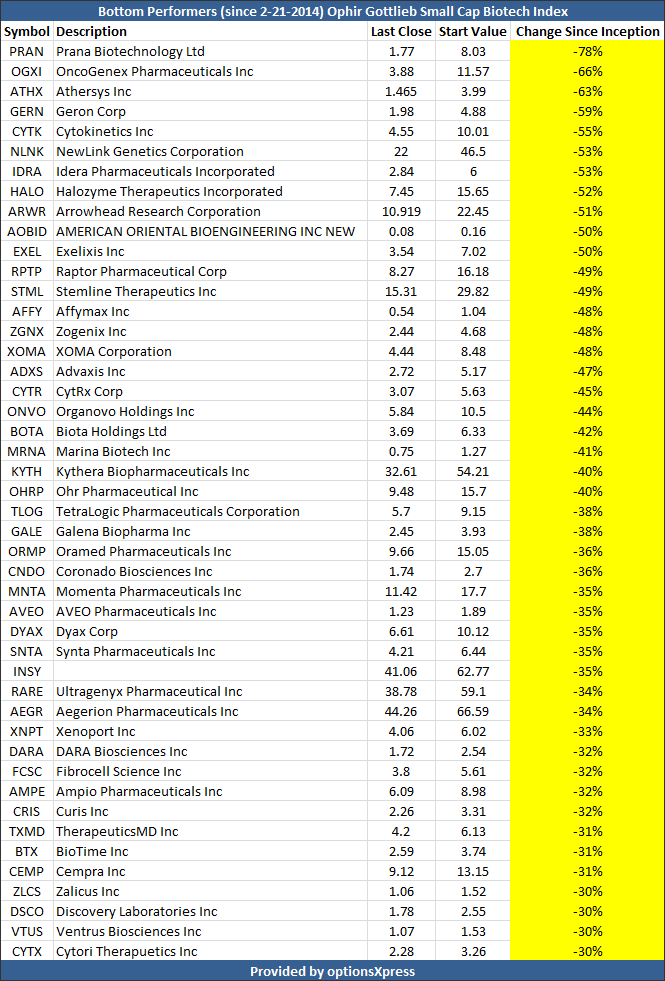
Biotech stocks Down 30%+


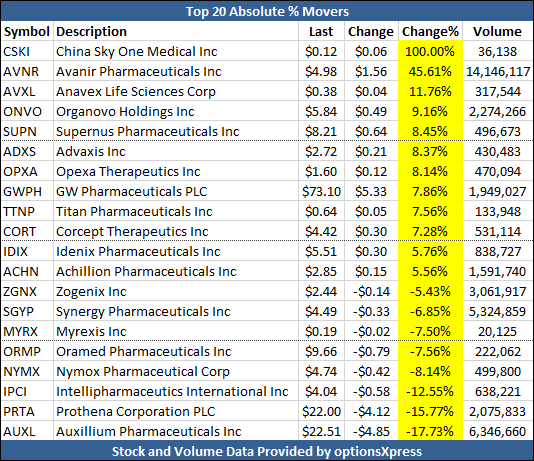
Today's Biotech Index Stock Movers


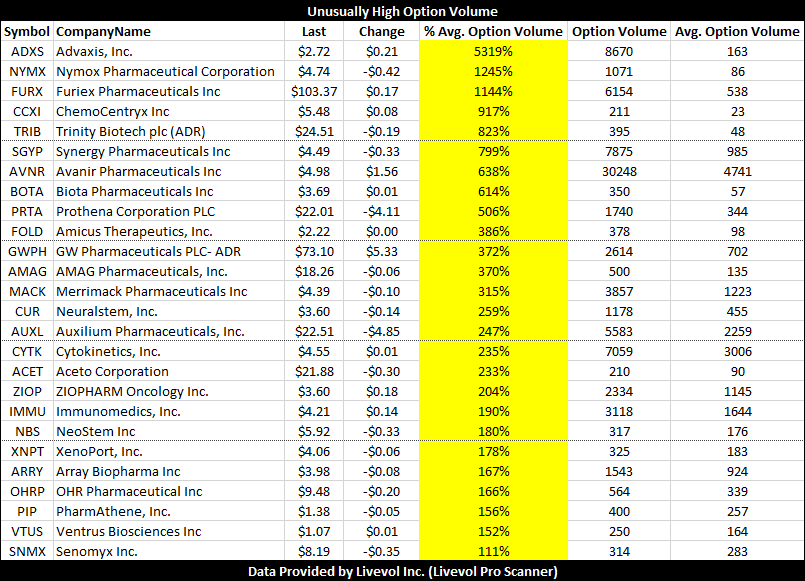
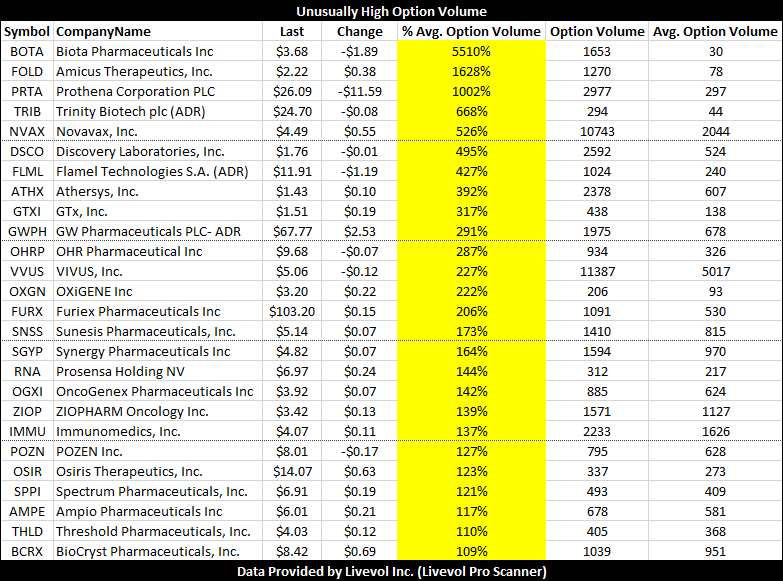
Today's Biotech Index Unusual Option Volume


Full Index Constituents and Moves


This is trade analysis, not a recommendation.


Legal Stuff:
Options involve risk. Prior to buying or selling an option, an investor must receive a copy of Characteristics and Risks of Standardized Options. Investors need a broker to trade options, and must meet suitability requirements.

The information contained on this site is provided for general informational purposes, as a convenience to the readers. The materials are not a substitute for obtaining professional advice from a qualified person, firm or corporation. Consult the appropriate professional advisor for more complete and current information. I am not engaged in rendering any legal or professional services by placing these general informational materials on this website.

I specifically disclaim any liability, whether based in contract, tort, strict liability or otherwise, for any direct, indirect, incidental, consequential, or special damages arising out of or in any way connected with access to or use of the site, even if I have been advised of the possibility of such damages, including liability in connection with mistakes or omissions in, or delays in transmission of, information to or from the user, interruptions in telecommunications connections to the site or viruses.

I make no representations or warranties about the accuracy or completeness of the information contained on this website. Any links provided to other server sites are offered as a matter of convenience and in no way are meant to imply that I endorse, sponsor, promote or am affiliated with the owners of or participants in those sites, or endorse any information contained on those sites, unless expressly stated.

Tesla Motors (TSLA) - Earnings Preview; How The Last Two Abrupt Earnings Moves Look to Today's Risk


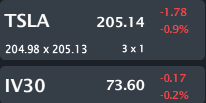
TSLA is trading $205.14, down 0.9% with IV30™ down 0.2%. The Symbol Summary is included below.
Provided by Livevol

This is an early pre-earnings note on TSLA.  I'll update the article right ahead of earnings in early May.  For those that follow me, you know I have a bit of an obsession with TSLA, and I have included the prior posts below.

--------
4-1-2014: NFLX, TSLA - Correlation of MOMO's May Point to Bubble Pop; 3 Things We Should Know

3-27-2014: TSLA - Risk Profile Changes; Momentum Stocks are Deflating... Right Now.

2-25-2014: TSLA - How We Already Knew The Stock Could Explode Today. A Full History of Skew in a Remarkable Company.

2-19-2014: TSLA - Earnings Preview and an Incredible Downside Bet

2-10-2014: TSLA - Risk Paradigm Shifts Again; Get Ready for Earnings, Risk is On.

1-14-2014: TSLA - Not a Bubble, But Stability. How TSLA popped Today, But We Already Knew That in November.

12-25-2013:TSLA - The Option Market: "This Isn't a Bubble, It's Equilibrium With Upside"

11-18-2013: TSLA - Stock Collapsing, Volatility Rising, but the Paradigm Has Not Shifted... Yet

11-6-2013: TSLA - Earnings Happened; Stock Falls Hard... But Do You Know The Facts About this Company?

8-8-2013: TSLA - Now a $20B Firm Off of Earnings Blow Out; How Wall St. Absolutely Blew It; But I didn't... And I'm Just a Guy...

5-9-2013: TSLA - Earnings Explosion Spectacle Hides Vol Shift -- This is a New Company -- A Paradigm Shift is Complete

5-15-2013: TSLA - May Skew Stays Parabolic; Vol Diff Opens... And Some Stuff You May Not Have Known...

5-29-2013: TSLA - This is a New Company; The Paradigm Shift Continues; Part 3 of 3.
--------

See... Obsession...

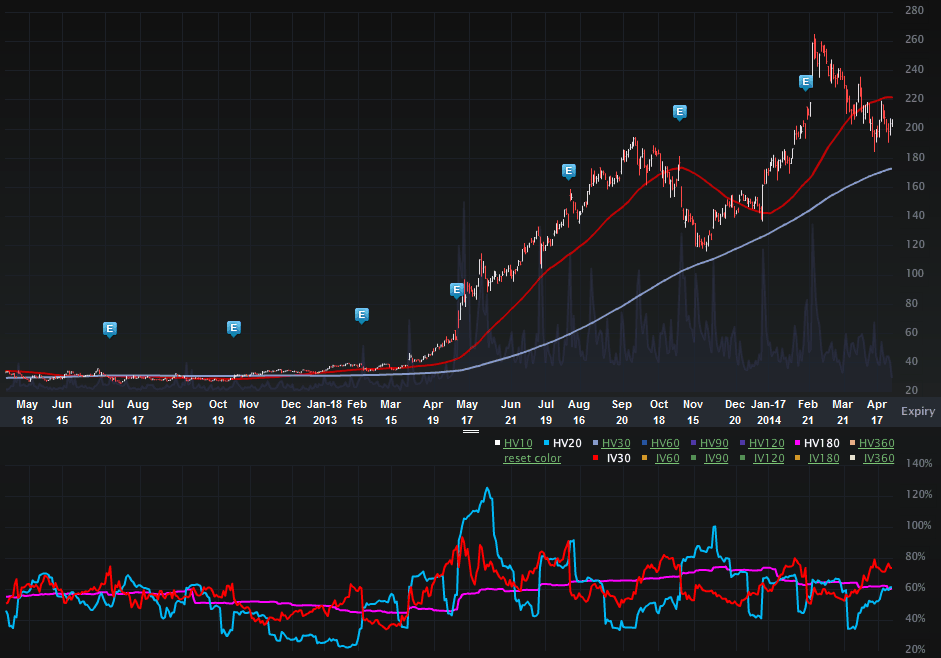
Anyway, onto earnings in a week. The Charts Tab (two-years) is below. The top portion is the stock price, the bottom is the vol (IV30™ - red vs HV20™ - blue vs HV180™ - pink).
Provided by Livevol

The stock price story we all know.  Up HUGE to $200, then down and pandemonium, then up HUGE again to $265.00, then down in the deflation of MOMO's to $205 today.

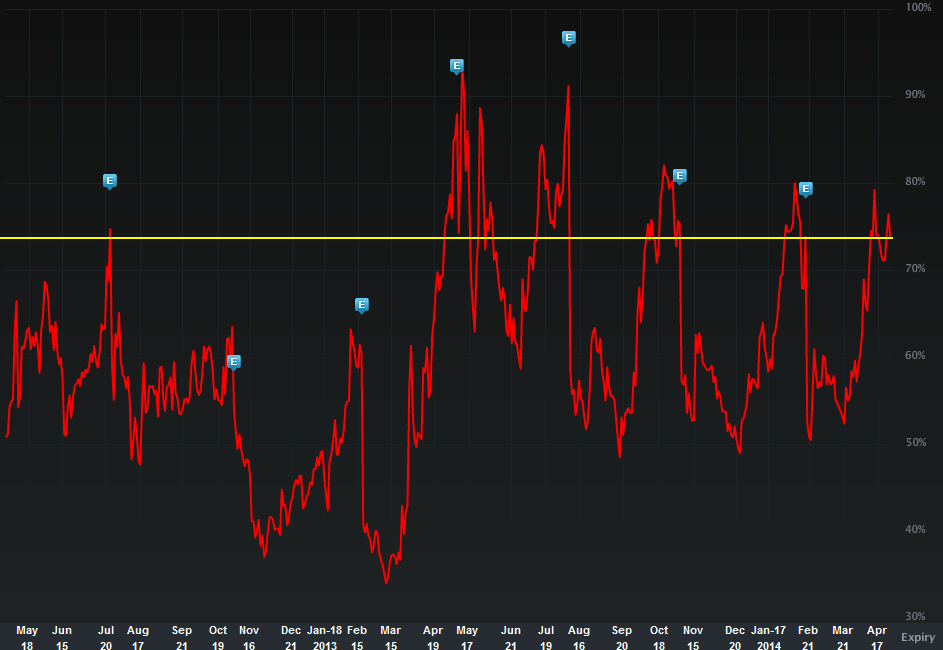
OK... But this is a volatility note, so let's turn to the IV30™ chart in isolation, below.
Provided by Livevol

The level of the implied today is actually in the 57th percentile on an annual basis, or in English, is kinda "middle of the road" for this year.  That percentile is thrown off a bit by that peak in the earnings vol four cycles ago (the blue "E" icons represent earnings).

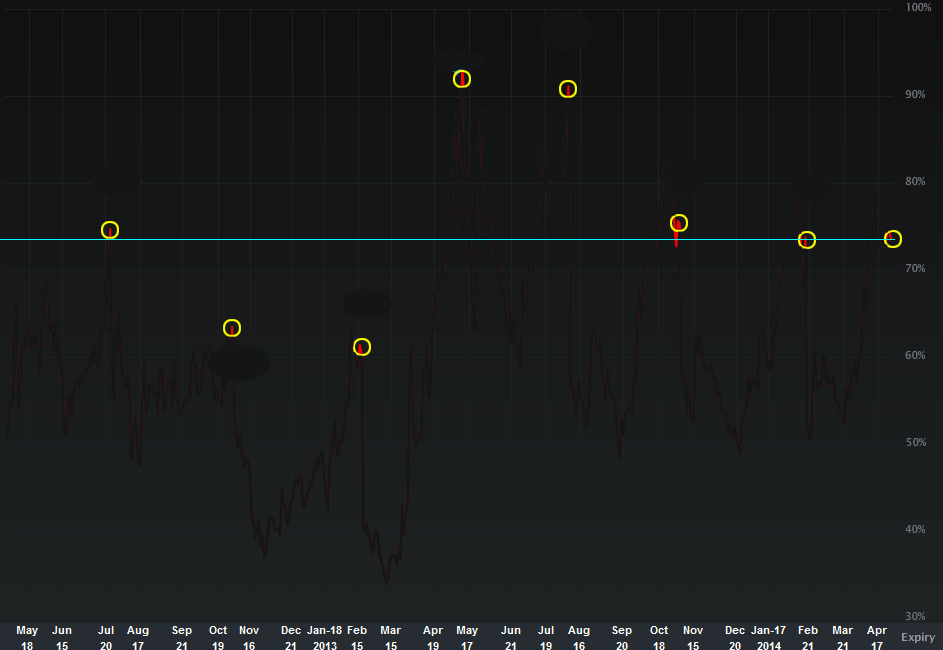
Let's compare the volatility right now to just prior earnings dates.
Provided by Livevol

We can see that the level today is basically exactly the level of the last two earnings cycles.  Keep in mind that with a week to go, TSLA vol will rise (should rise), so the risk as reflected y the option market (volatility) should be higher for the upcoming earnings release than the prior two.  That feels right.

What did TSLA do in the last earnings cycles?
11-5-2013: $176.81 --> $151.16 --> $139.77 in three days.
2-19-2014: $193.64 --> $209.97 --> $248.00 in six days.

Note the abruptness both of the one-day moves, and the following several days.  The option market didn't have moves priced anywhere near that level.

History does not always repeat itself, though.

The Skew Tab snap (below) illustrates the vols by strike.
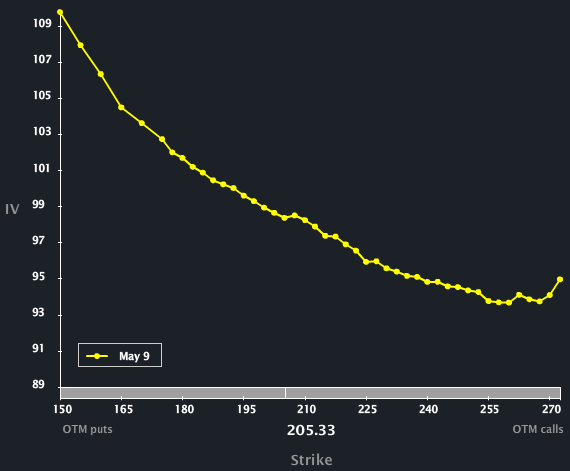
Provided by Livevol

Much like most of the recent earnings notes I have been posting, the skew is normal, which is kind of abnormal going into earnings.  I would have expected parabolic skew -- a reflection of equal two tail risk.  What does parabolic skew look like?  Funny you should ask.  Here is the skew for the weekly options ending in 2.5 days for TSLA:
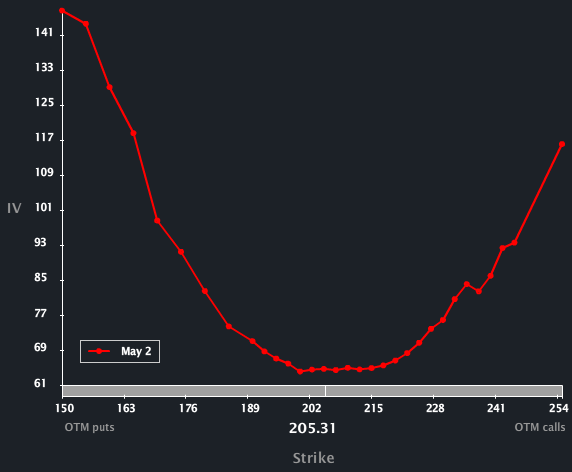

Provided by Livevol

So that's what I had in mind for the volatility skew shape in the option that have earnings.  But... we don't see that.  We didn't see it in TWTR, we don't see it in LNKD... So far, no huge tail up moves, so perhaps the upside is priced correctly.

To read more about skew, what is and why it exists you can click the title below:
Understanding Option Skew -- What it is and Why it Exists.

Finally, the Options Tab is included below.
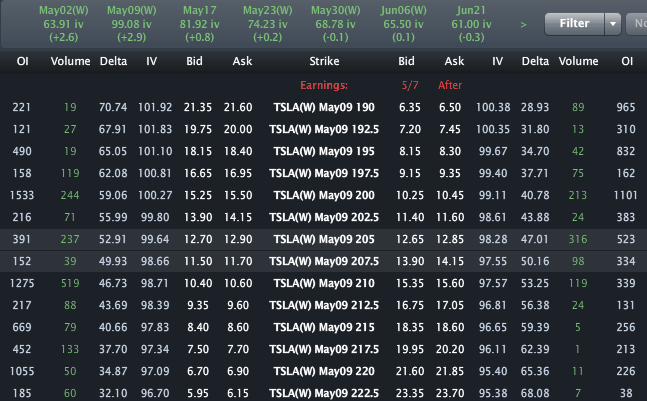
Provided by Livevol

The option market as of today is pricing in a range for TSLA of [$179.50, $230.5] by the end of trading on May 9th.

  • If you believe the stock will be outside that range on expiry or any date before then, then you think the volatility is too low.
  • If you believe that range is too wide, and that the stock will definitively be in that range on expiration, then you think volatility is too high.
  • If you're not sure, and can make an argument for either case, then you think volatility is priced just about right.

This is trade analysis, not a recommendation.


Legal Stuff:
Options involve risk. Prior to buying or selling an option, an investor must receive a copy of Characteristics and Risks of Standardized Options. Investors need a broker to trade options, and must meet suitability requirements.

The information contained on this site is provided for general informational purposes, as a convenience to the readers. The materials are not a substitute for obtaining professional advice from a qualified person, firm or corporation. Consult the appropriate professional advisor for more complete and current information. I am not engaged in rendering any legal or professional services by placing these general informational materials on this website.

I specifically disclaim any liability, whether based in contract, tort, strict liability or otherwise, for any direct, indirect, incidental, consequential, or special damages arising out of or in any way connected with access to or use of the site, even if I have been advised of the possibility of such damages, including liability in connection with mistakes or omissions in, or delays in transmission of, information to or from the user, interruptions in telecommunications connections to the site or viruses.

I make no representations or warranties about the accuracy or completeness of the information contained on this website. Any links provided to other server sites are offered as a matter of convenience and in no way are meant to imply that I endorse, sponsor, promote or am affiliated with the owners of or participants in those sites, or endorse any information contained on those sites, unless expressly stated.
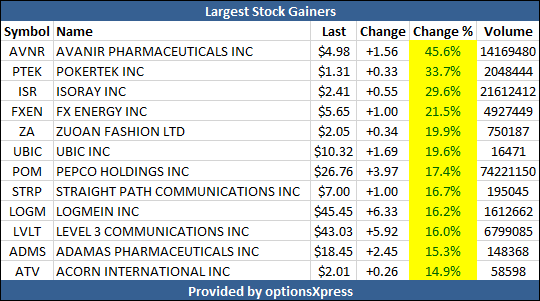
4-30-2014: Open Interest Report


Daily Option Interest Report

Largest One-day Open Interest Increases


Largest Current Open Interest Relative to 90-day Average


This is trade analysis, not a recommendation.


Legal Stuff:
Options involve risk. Prior to buying or selling an option, an investor must receive a copy of Characteristics and Risks of Standardized Options. Investors need a broker to trade options, and must meet suitability requirements.

The information contained on this site is provided for general informational purposes, as a convenience to the readers. The materials are not a substitute for obtaining professional advice from a qualified person, firm or corporation. Consult the appropriate professional advisor for more complete and current information. I am not engaged in rendering any legal or professional services by placing these general informational materials on this website.

I specifically disclaim any liability, whether based in contract, tort, strict liability or otherwise, for any direct, indirect, incidental, consequential, or special damages arising out of or in any way connected with access to or use of the site, even if I have been advised of the possibility of such damages, including liability in connection with mistakes or omissions in, or delays in transmission of, information to or from the user, interruptions in telecommunications connections to the site or viruses.

I make no representations or warranties about the accuracy or completeness of the information contained on this website. Any links provided to other server sites are offered as a matter of convenience and in no way are meant to imply that I endorse, sponsor, promote or am affiliated with the owners of or participants in those sites, or endorse any information contained on those sites, unless expressly stated.
Tuesday, April 29, 2014

Twitter (TWTR) - Earnings Postmortem; Just The Facts: Everything You Need to Know


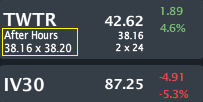
TWTR just released earnings and after hours the stock is trading at around $38.15 down from a close of $42.62. The Symbol Summary is included below.

Provided by Livevol

Note that I have highlighted the AH trades.
---------------
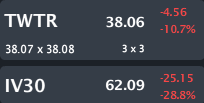
UPDATE 4-30-2014

Provided by Livevol

TWTR has in fact broken into a new all-time low.
---------------

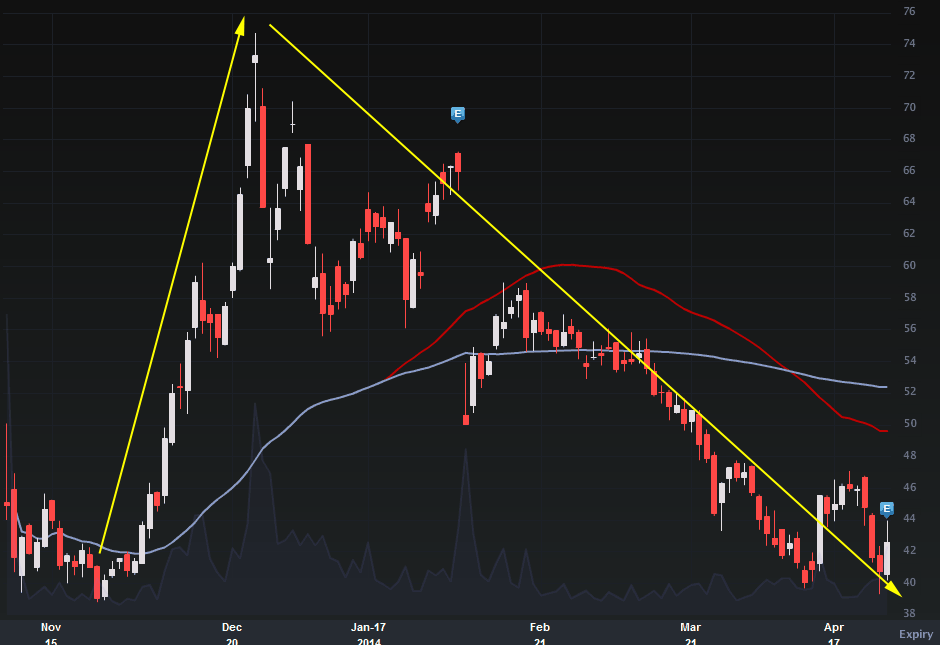
This is a review of all the information that has come out thus far from the earnings release.  First, with respect to stock price, I have included the all-time stock price for TWTR, below.

Provided by Livevol

We can see the meteoric rise and the equally abrupt fall in price.  The all-time low for TWTR is $38.80 and for the moment (it's just a moment in AH), it is now trading below that all-time low.

Now, the earnings results:


  • Average Active Users: 255M up 5.8% quarter-over-quarter and 25% Y-O-Y
  • "Freshened" Timelines: 157 billion times up 15% from last year but below analyst estimates
  • Revenue: $250M (up 119% from $114M a year ago) above estimates of $241.5M
  • Ad Revenue per Thousand Timeline Views: $1.44 (nearly 2x last quarter).
  • Ad Revenue: $226M up 125% from year ago
  • Mobile Ad Revenue: 80% of total revenue
  • Mobile Ad Market Share: Estimate 2.7% (up from 2.4%) vs FB 22% and GOOG 47%
  • "Excluding Items" EPS: Even vs. expected -0.03 (loss)
  • Net Loss: $135MM (up 5x from $27M a year ago)

Future:
Revenue Next Quarter: Company forecasts $272M; Wall St. estimates were [$270M, $280M]
Revenue for Full Year: Wall St. Estimates: $1.2B - $1.25B

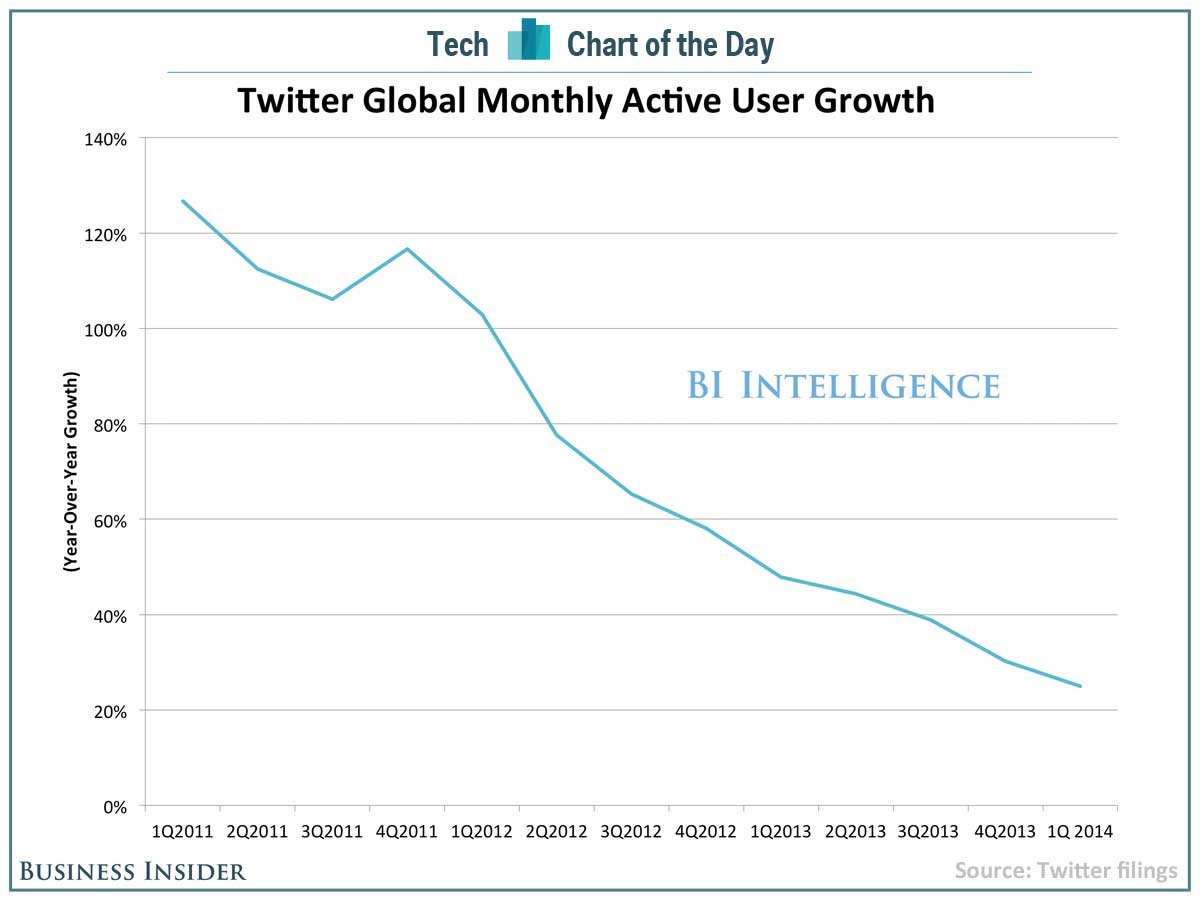
But, the chart of the day comes from BUSINESS INSIDER:


Provided by BUSINESS INSIDER

Yep... Active user growth is down to 5.8% quarter over quarter, down from over 120%. Can you imagine if that turns negative?... yikes.

For the record my position is:
Long CS 46/48
Long PS 39/37

This is trade analysis, not a recommendation.


Legal Stuff:
Options involve risk. Prior to buying or selling an option, an investor must receive a copy of Characteristics and Risks of Standardized Options. Investors need a broker to trade options, and must meet suitability requirements.

The information contained on this site is provided for general informational purposes, as a convenience to the readers. The materials are not a substitute for obtaining professional advice from a qualified person, firm or corporation. Consult the appropriate professional advisor for more complete and current information. I am not engaged in rendering any legal or professional services by placing these general informational materials on this website.

I specifically disclaim any liability, whether based in contract, tort, strict liability or otherwise, for any direct, indirect, incidental, consequential, or special damages arising out of or in any way connected with access to or use of the site, even if I have been advised of the possibility of such damages, including liability in connection with mistakes or omissions in, or delays in transmission of, information to or from the user, interruptions in telecommunications connections to the site or viruses.

I make no representations or warranties about the accuracy or completeness of the information contained on this website. Any links provided to other server sites are offered as a matter of convenience and in no way are meant to imply that I endorse, sponsor, promote or am affiliated with the owners of or participants in those sites, or endorse any information contained on those sites, unless expressly stated.
04-29-14: End of Day Report - Largest Stock Moves, New 52 Wk. Highs/Lows, Unusual Option Volume


Top Headlines
If the era of uncertainty is over, should investors worry?

Twitter reports results with focus on user growth: live blog

Risk of 20% stock correction highest until October: B. of A.’s Suttmeier

Top option Story
YELP - Earnings Preview and Something I Bet You Didn't Know

LinkedIn (LNKD) - Earnings Preview: Option Market Explodes to New Highs in Risk


Open Interest Report
4-29-2014: Daily Open Interest Report

Biotech Index
Daily Biotech Small & Micro Cap Update

Market Overview

Largest Stock Gainers


Largest Stock Losers


New 52 Wk Highs in S&P 500


New 52 Wk Lows in S&P 500
No New Lows


Unusual Option Volume


Elevated Implied Volatility (IV) to Historical Volatility (HV)


This is trade analysis, not a recommendation.


Legal Stuff:
Options involve risk. Prior to buying or selling an option, an investor must receive a copy of Characteristics and Risks of Standardized Options. Investors need a broker to trade options, and must meet suitability requirements.

The information contained on this site is provided for general informational purposes, as a convenience to the readers. The materials are not a substitute for obtaining professional advice from a qualified person, firm or corporation. Consult the appropriate professional advisor for more complete and current information. I am not engaged in rendering any legal or professional services by placing these general informational materials on this website.

I specifically disclaim any liability, whether based in contract, tort, strict liability or otherwise, for any direct, indirect, incidental, consequential, or special damages arising out of or in any way connected with access to or use of the site, even if I have been advised of the possibility of such damages, including liability in connection with mistakes or omissions in, or delays in transmission of, information to or from the user, interruptions in telecommunications connections to the site or viruses.

I make no representations or warranties about the accuracy or completeness of the information contained on this website. Any links provided to other server sites are offered as a matter of convenience and in no way are meant to imply that I endorse, sponsor, promote or am affiliated with the owners of or participants in those sites, or endorse any information contained on those sites, unless expressly stated.
Daily Biotech Small & Micro Cap Update


The Ophir Gottlieb Small Cap Biotech Index
Is this the biotech revolution or the biotech bust?


231 small / micro cap biotech and pharma companies (equal weighted):
  • Public Biotech and Pharma Companies
  • Trade on North American Exchanges
  • Market Cap Range: [$0, $2 Billion]
  • Price, Employees, Revenue Range: Any

More on index construction and performance: The Ophir Gottlieb Small Cap Biotech Index

Today's Biotech Index Stock Movers


Today's Biotech Index Unusual Option Volume


Full Index Constituents and Moves


This is trade analysis, not a recommendation.


Legal Stuff:
Options involve risk. Prior to buying or selling an option, an investor must receive a copy of Characteristics and Risks of Standardized Options. Investors need a broker to trade options, and must meet suitability requirements.

The information contained on this site is provided for general informational purposes, as a convenience to the readers. The materials are not a substitute for obtaining professional advice from a qualified person, firm or corporation. Consult the appropriate professional advisor for more complete and current information. I am not engaged in rendering any legal or professional services by placing these general informational materials on this website.

I specifically disclaim any liability, whether based in contract, tort, strict liability or otherwise, for any direct, indirect, incidental, consequential, or special damages arising out of or in any way connected with access to or use of the site, even if I have been advised of the possibility of such damages, including liability in connection with mistakes or omissions in, or delays in transmission of, information to or from the user, interruptions in telecommunications connections to the site or viruses.

I make no representations or warranties about the accuracy or completeness of the information contained on this website. Any links provided to other server sites are offered as a matter of convenience and in no way are meant to imply that I endorse, sponsor, promote or am affiliated with the owners of or participants in those sites, or endorse any information contained on those sites, unless expressly stated.