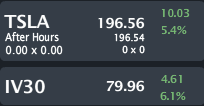
TSLA closed Monday trading at $196.56, up 5.4% with IV30™ up 6.1%. The Symbol Summary is included below.
Provided by Livevol
This is a follow up to the articles I published on 1-14-2014, 12-25-2013 and 11-18-2013. You can read the posts by clicking on the titles, below.
I note that TSLA has earnings due out on 2-19-2014, so I will post a pre-earnings article... And from the looks of things, it's gonna need it. This story is just starting to build again. Oh, and before I forget, TSLA just hit an all-time high today.
Bottom line: The option market has nailed TSLA stock movement of late, most recently reflecting that "This Isn't a Bubble, It's Equilibrium With Upside." But things have changed... and we have earnings in nine days.
1-14-2014
Tesla Motors (TSLA) - Not a Bubble, But Stability. How TSLA popped Today, But We Already Knew That in November.
12-25-2013
Tesla (TSLA) - The Option Market: "This Isn't a Bubble, It's Equilibrium With Upside"
11-18-2013
Tesla Motors (TSLA) - Stock Collapsing, Volatility Rising, but the Paradigm Has Not Shifted... Yet
The point of the prior blog posts were pretty simple...
I have written about TSLA extensively (compulsively?) in the past. Before getting into the details I do make one quick note. In the post on 11-18-2013 I wrote that the skew in TSLA still showed a likelihood of an upside move (parabolic skew -- details below in the article). Since then the stock went from $124.76 to now $196.56.
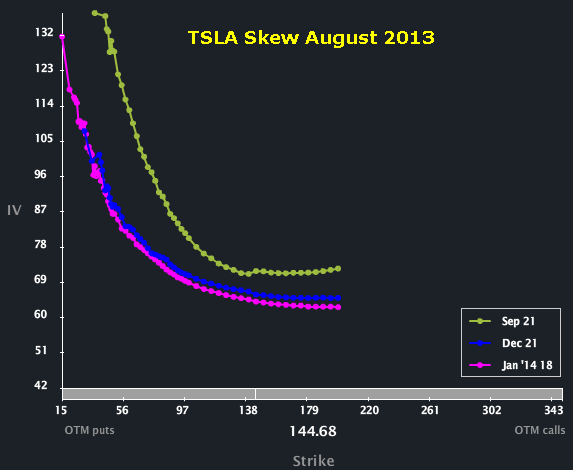
To start the analysis, we have to look at the skew in TSLA over time. Let's start with August 2013.
Provided by Livevol
Note that the skew shape across the front three months; it was "normal"; the Out-of-the-money (OTM) puts were priced to higher volatility than the at-the-money (ATM) option and the OTM calls. To read more about skew, what is and why it exists you can click the title below:
Understanding Option Skew -- What it is and Why it Exists.
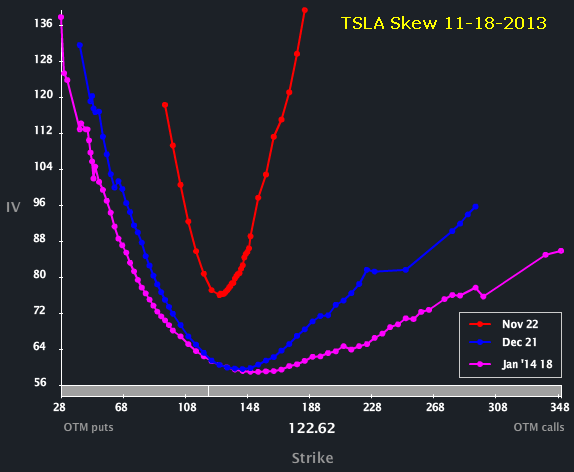
While TSLA had normal skew back then (with the stock price at $135), the skew shape shifted dramatically as the long interest grew. Let's turn to the Skew Tab as of 11-18-2013, below.
Provided by Livevol
Note how we saw a parabolic skew shape in November, which meant that the option market reflected equally elevated risk to the upside and the downside. So, while the stock had been collapsing, the option market still read "upside has potential."
On 12-25-2013 I wrote:
Watch this skew shape, if it turns back to the "old shape" (which is really a normal shape), then that would mean the option market no longer reflects that upside potential and that would in fact be a paradigm shift (again) for TSLA.
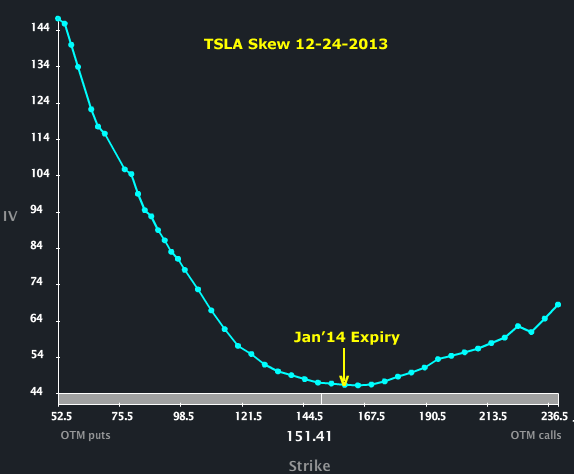
Here's how the skew looked on 12-25-2013:
Provided by Livevol
It was still parabolic.
But in Jan of this year, and today, we finally see the skew back to "normal." Look at the Skew Chart as of today (2-10-2014):
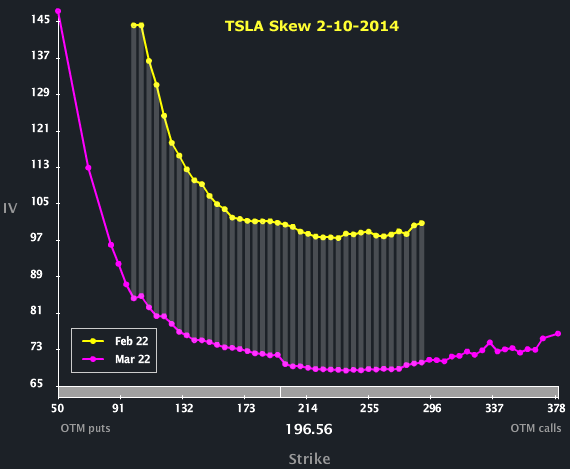
Provided by Livevol
Compare the skew today to the skew from August 2013 -- they look nearly identical. That upside tilt has gone away, and it had persisted for a very long time, even as the stock was dropping. TSLA has earnings due out on 2-19-2014, which makes the skew reversion even more eye popping. Usually TSLA shows a parabolic skew into earnings. But not now...
Let's turn first turn to to the IV30™ chart from 12-25-2013 in isolation, below.

Provided by Livevol
That was pretty awesome -- we saw that as the stock had been rising, and even as the stock was dropping prior, the volatility had been dipping. The option market read that TSLA was becoming quite comfortably into this valuation... and it continued to rise.
But as earnings are approaching, the volatility is finally rising (as expected).
Let's turn to the two-year Charts Tab below. The top portion is the stock price, the bottom is the vol (IV30™ - red vs HV20™ - blue vs HV180™ - pink).
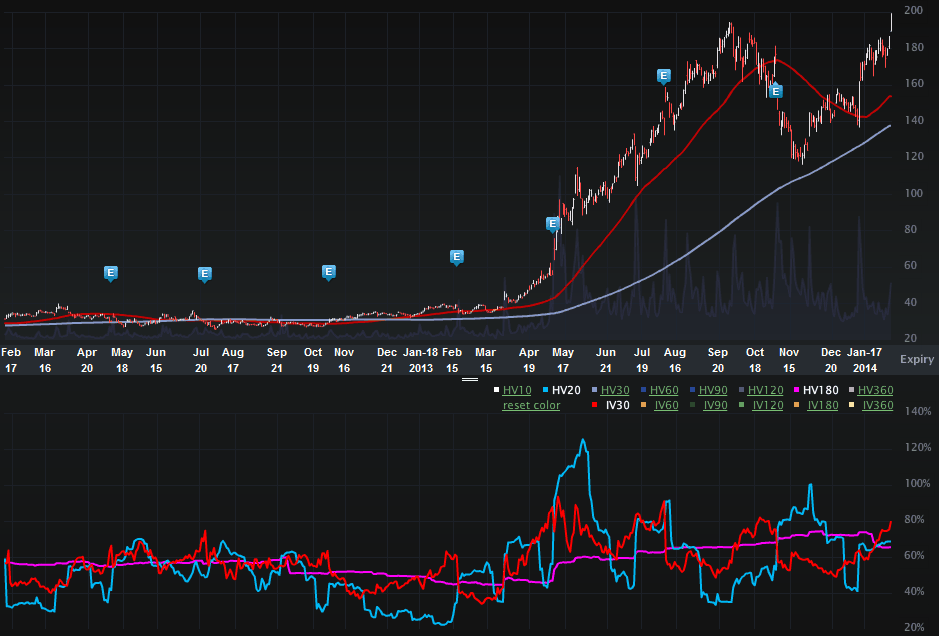
Provided by Livevol
Two things to note:
1. The stock just breached an all-time high today. TSLA is now a $24 billion market cap company.
2. Check out that volatility rise as the stock has been rising (quite different from the past).
To see the IV30™ move more clearly, I have included the two-year IV30™ chart in isolation, below.
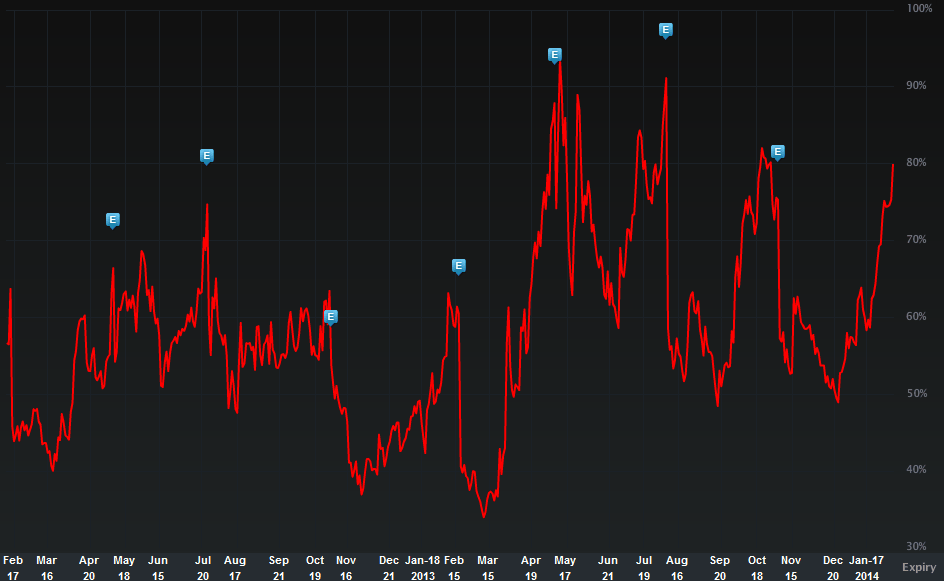
Provided by Livevol
Yes it's rising b/c of earnings, but it started rising well ahead of the event. Actually, it started right about when I posted the 12-25-2013 article. The volatility is up from ~50% to now ~80%, and the stock is up from ~$150. That volatility will rise unless there is some big pre-announcement. Watch for IV30 to hit near 100%.
So what?...
While the option market nailed this one through January 2014, it has now signaled a new risk paradigm. Namely, two-tailed risk is off (no upside tilt), and overall risk is up.
As I wrote in January:
"I do note one critical change here... The implied volatility is rising again in TSLA. Hold on, this could get bumpy... again..."
It's gonna get bumpy. And that's not even referencing earnings yet... Watch this one. I will...
This is trade analysis, not a recommendation.
Follow @OphirGottlieb
Tweet
Legal Stuff:
Options involve risk. Prior to buying or selling an option, an investor must receive a copy of Characteristics and Risks of Standardized Options. Investors need a broker to trade options, and must meet suitability requirements.
The information contained on this site is provided for general informational purposes, as a convenience to the readers. The materials are not a substitute for obtaining professional advice from a qualified person, firm or corporation. Consult the appropriate professional advisor for more complete and current information. I am not engaged in rendering any legal or professional services by placing these general informational materials on this website.
I specifically disclaim any liability, whether based in contract, tort, strict liability or otherwise, for any direct, indirect, incidental, consequential, or special damages arising out of or in any way connected with access to or use of the site, even if I have been advised of the possibility of such damages, including liability in connection with mistakes or omissions in, or delays in transmission of, information to or from the user, interruptions in telecommunications connections to the site or viruses.
I make no representations or warranties about the accuracy or completeness of the information contained on this website. Any links provided to other server sites are offered as a matter of convenience and in no way are meant to imply that I endorse, sponsor, promote or am affiliated with the owners of or participants in those sites, or endorse any information contained on those sites, unless expressly stated.


For dumbers like me....does it mean it has more downside compared to upside?
ReplyDelete