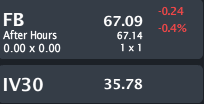
FB closed Friday trading at $67.09, down small with IV30™ at 35.78%. The Symbol Summary is included below.
Provided by Livevol
Facebook, Inc. (Facebook) is engaged in building products to create utility for users, developers, and advertisers. People use Facebook to stay connected with their friends and family, to discover what is going on in the world around them, and to share and express what matters to them to the people they care about.
This is a quick look at "The State of The Facebook." I'll focus on market capitalization, stock price and of course... implied volatility.
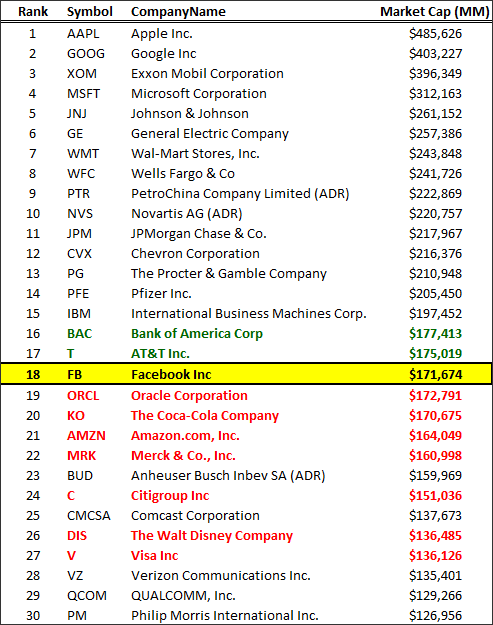
Let's start quick and easy. Below I have included the 30 largest market cap firms in the United States (ADRs excluded). We can see FB is #18... Did you know that?
Provided by Livevol
Some interesting names to note on this list. FB is larger than:
Disney
Coca-Cola
Amazon
Visa
Citigroup (yeah, that Citigroup)
Oracle
Merck
FB is one good stock day away from eclipsing AT&T and Bank of America in market cap size.
Let's look to the Charts Tab (two-years). The top portion is the stock price, the bottom is the vol (IV30™ - red vs HV20™ - blue vs HV180™ - pink).

Provided by Livevol
In we take FB's market cap from summer of last year (i.e. seven months ago) and apply it to today, it would not be in the top 100... Today, it's #18.
What's changed?... Better than expected execution. Here are some snippets from the latest earnings release per an AP article:
---
Facebook Inc., which turns 10 next week, said Wednesday that more than half of its advertising revenue now comes from mobile. That's a big milestone considering it only started showing mobile ads in 2012.
Investors fretted at the time that it wouldn't be able to evolve into a "mobile-first" company. The quarter's results are a sign that it has. At the end of 2013, more than three-quarters of Facebook's 1.23 billion users — 945 million — logged in using their mobile devices at least once a month.
Baird Equity analyst Colin Sebastian said key user metrics and engagement trends — that is, how much and how often people use Facebook — remain healthy. He noted that advertising revenue accelerated for the seventh consecutive quarter.
Source: AP via Yahoo! Finance Facebook soars to record high after strong 4Q
---
So in English, FB has become the true leader in mobile ads. An idea that some (many?) scoffed at when Zuckerberg discussed the strategy a few quarters earlier. They were wrong, he was right... again... for now...
So the stock is up and in a way that is actually affecting the worldwide stage of mega caps. Let's turn to the way risk is reflected in the option market.
Let's turn to the IV30™ chart in isolation, below.
Provided by Livevol
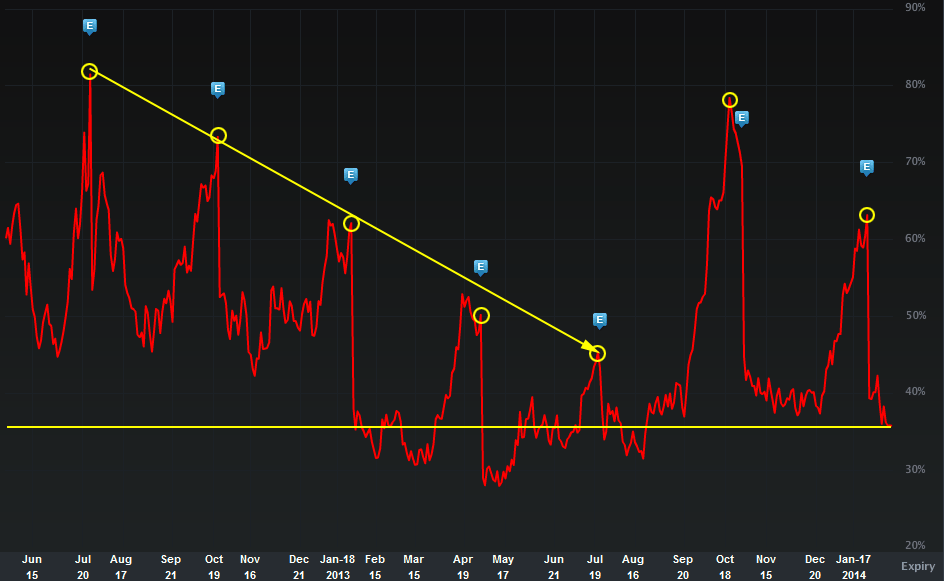
The blue "E" icons represent earnings dates. The implied vol rises into the event and then generally crushes downward after the news (regardless of the direction of the stock move).
The first thing I note is how substantially the earnings peak volatility was falling for each earnings period from Summer 2012 through Summer 2013. We see five consecutive earnings periods with lower volatility topping at 81.51% and finally falling to 45.37%.
And what did the stock do in that period while the option market reflected less and less risk in earnings?... It went from $26.84 to $26.51 just before the Summer 2013 earnings release. In other words, up to that point, the option market was remarkably accurate. The historical realized risk in FB shares over that period (close-to-close) was essentially nil.
But then earnings on 7-24-2013 after the close happened. The next day the stock popped from $26.51 to $34.36 or ~30% higher in a day. And did that surprise affect the option market for the next earnings cycle?... yeah, a lot.
That next "E" shows an IV30™ of 78.41%, the highest since the Summer of 2012. The stock only moved ~$1.20 on the Oct 2013 earnings, and what do you know, the next earnings period (Jan 2014) the implied was back down to 63.22%. But... the stock popped on that release $53.53 to $61.08 and now the stock is right at an all-time high of $67.09.
So what was the purpose of that?... Two fold:
1. The option market was right on the money at reflecting lower and lower risk in FB shares into earnings as the stock essentially stood still from close-close in over a year.
2. I think the option market may be wrong right now.
The current IV30™ of 35.76% is in the 16th percentile for the last year, or in English, low... I've drawn a horizontal yellow line to show exactly where the current implied sits relative to the past.
FB is now the 18th largest firm, on the brink of the 16th largest in a rather frothy US market. I don't see low risk... I see high risk...
Let's turn to the Skew Tab, below.
Provided by Livevol
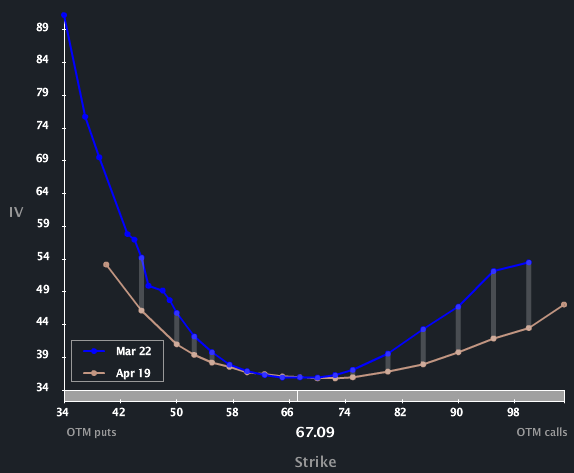
We can see that both Mar and Apr options show a parabolic skew, which is "abnormal" and reflects both upside and downside risk equally. I also think that may be wrong. Do you feel the upside risk in FB is equal to the downside risk right now or out to the end of April? I don't...
To learn more about option skew you can read the post below:
Understanding Option Skew -- What it is and Why it Exists.
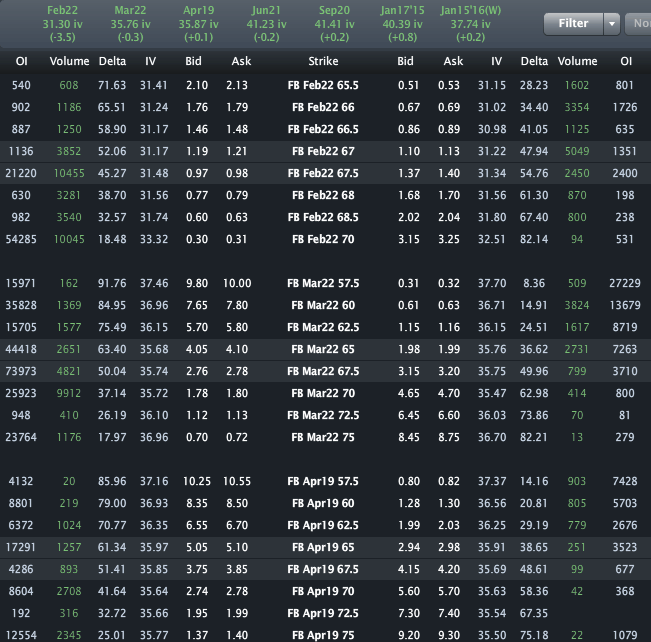
Finally, the Options Tab is included below.
Provided by Livevol
So this is simple. Let's look to Apr options. The at-the-money (ATM) straddle is the $67.50 strike as prices a stock range to Apr expiration of [~$59.50, $75.50]. Will FB remain in that range for the entirety of that time range (i.e. break out of that range at anytime until Apr expiration)?
I dunno... I guess we'll see... But either way, this is "The State of The Facebook."
This is trade analysis, not a recommendation.
Follow @OphirGottlieb
Tweet
Legal Stuff:
Options involve risk. Prior to buying or selling an option, an investor must receive a copy of Characteristics and Risks of Standardized Options. Investors need a broker to trade options, and must meet suitability requirements.
The information contained on this site is provided for general informational purposes, as a convenience to the readers. The materials are not a substitute for obtaining professional advice from a qualified person, firm or corporation. Consult the appropriate professional advisor for more complete and current information. I am not engaged in rendering any legal or professional services by placing these general informational materials on this website.
I specifically disclaim any liability, whether based in contract, tort, strict liability or otherwise, for any direct, indirect, incidental, consequential, or special damages arising out of or in any way connected with access to or use of the site, even if I have been advised of the possibility of such damages, including liability in connection with mistakes or omissions in, or delays in transmission of, information to or from the user, interruptions in telecommunications connections to the site or viruses.
I make no representations or warranties about the accuracy or completeness of the information contained on this website. Any links provided to other server sites are offered as a matter of convenience and in no way are meant to imply that I endorse, sponsor, promote or am affiliated with the owners of or participants in those sites, or endorse any information contained on those sites, unless expressly stated.


No comments:
Post a Comment