| Tweet | Follow @OphirGottlieb |  |  |

This visualization is provided by:
Make These Visualizations Yourself: Free Trial
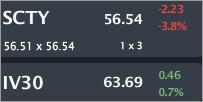
SCTY is trading $56.54, down 3.8% with IV30™ up 0.7%. The Symbol Summary is included below.
Provided by Livevol
------------------------------
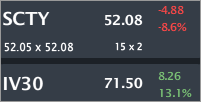
Update: One day later (pre-earnings)
Provided by Livevol
This is a remarkable move in the stock price and the volatility ahead of earnings. It's almost as if the option market "corrected itself" just ahead of the news due out in less than an hour.
------------------------------
Conclusion
SCTY has earnings due out tomorrow (11-5-2014) after the market closes. There are three fascinating phenomena occurring in SCTY that we have to examine before the earnings release.
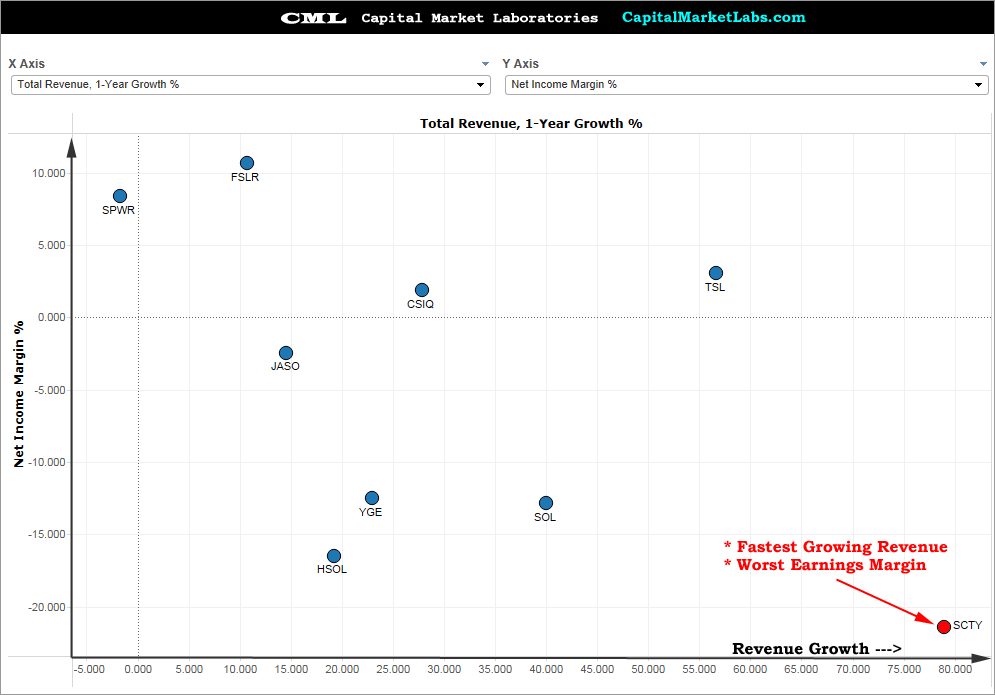
1. The company has the worst earnings margin % of any solar company yet the largest revenue growth. Here's that statement in an image with total revenue, 1-year growth on the x-axis and net income margin % on the y-axis.
2. SCTY has the highest Price to Sales ratio of any solar stock.
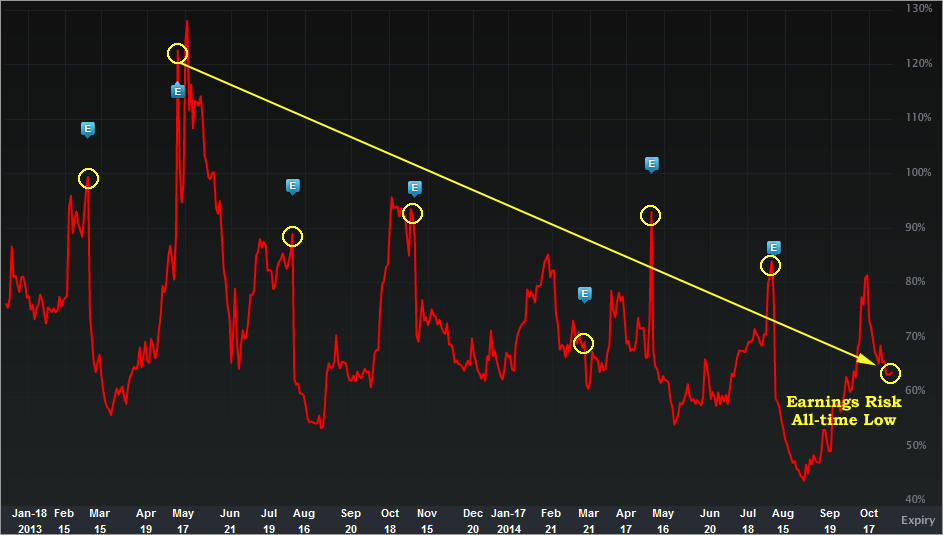
3. The risk as reflected by the option market into this earnings is the lowest it has ever been for any earnings release for SCTY. Now that is something...
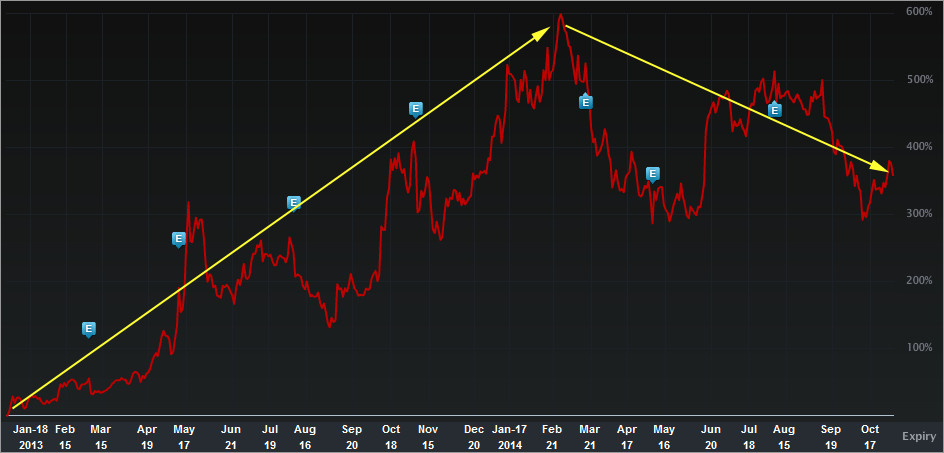
Let's start with all-time stock return chart.
Provided by Livevol
We can see the equity price for SCTY boomed from IPO to 600% gain in about a year, and since has fallen about 40%. This earnings release is poised to be a very important one, and I have no idea why the option market is pricing in so little risk.
Let's turn to the financial measures
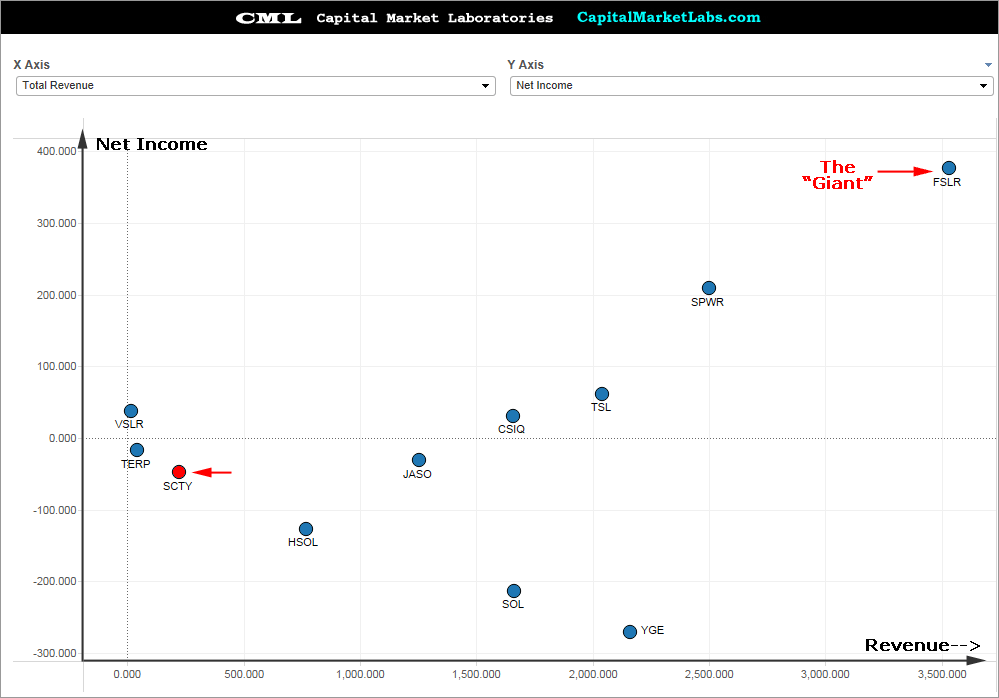
Solar Landscape: Revenue vs. Net Income
We can see rather easily that FSLR is the largest solar stock both in terms of revenue and earnings. We can also see that SCTY is a baby compared to FSLR with respect to revenue and earnings.
Now we can focus on SCTY.
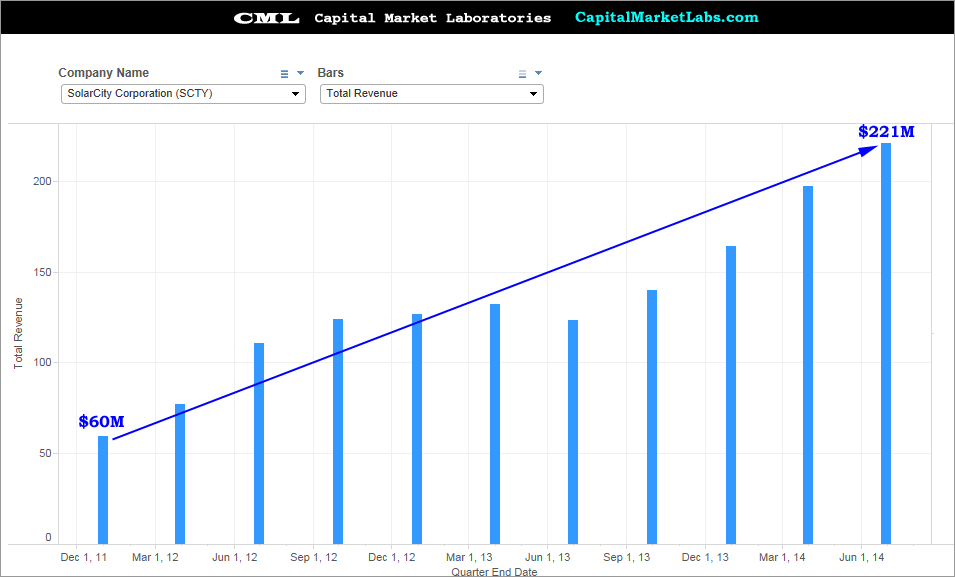
Revenue (TTM)
SCTY has seen revenue grow from $60M all the way to $221M in the trailing-twelve-months. It's this revenue growth that put them in far right of the first inage in this post... Fastest growing revenue.
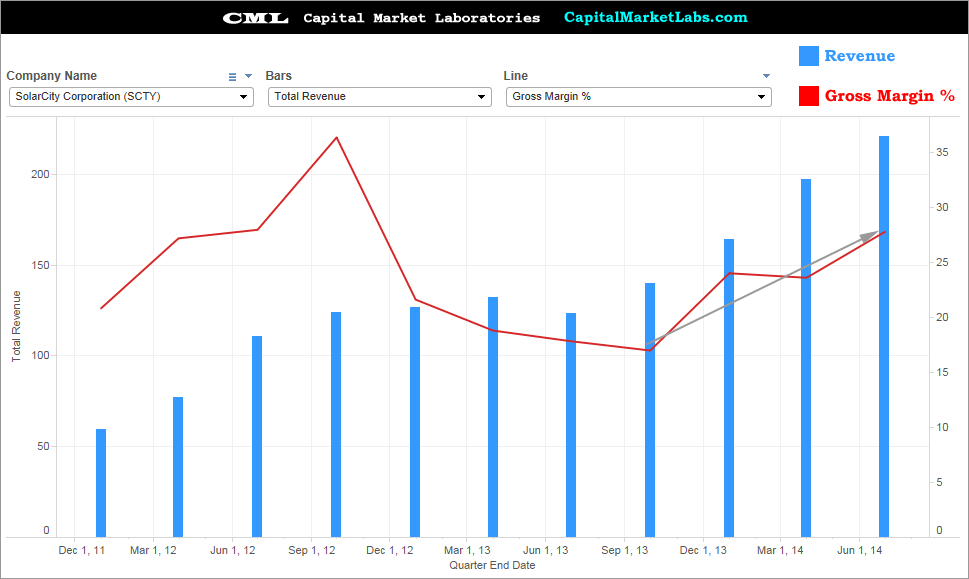
Revenue (TTM) vs. Gross Margin %
SCTY has a really nice trend forming with respect to gross margin %. While it dipped rather abruptly from over 35% to ~15% as revenue was growing, it has risen again to ~27%. This will be one of very few measures that will be a hyper focus in the earnings report,
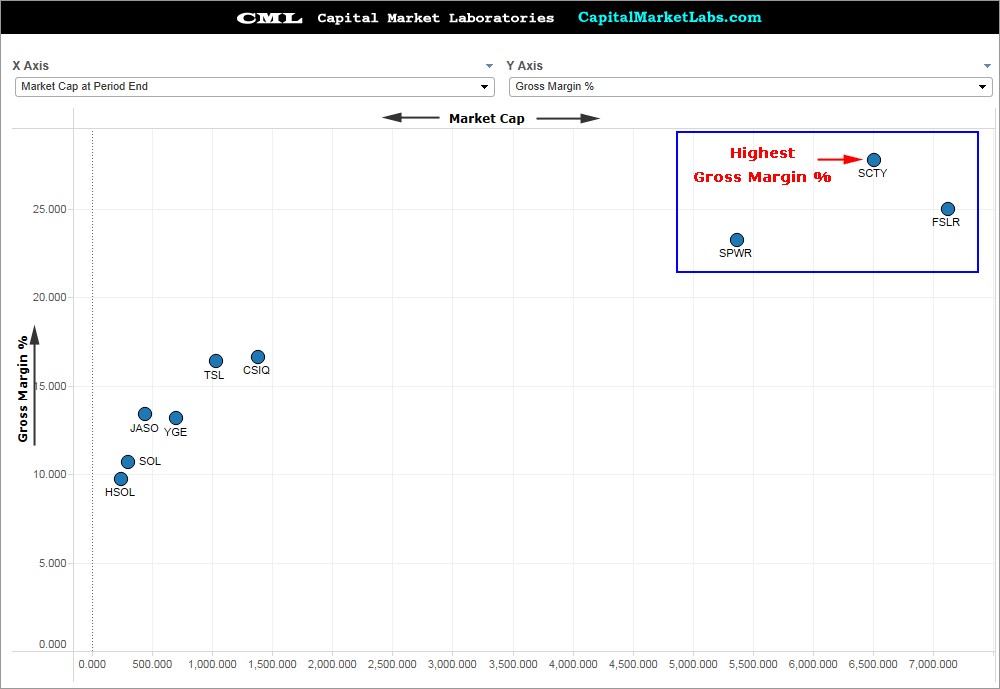
Gross Margin % vs Peers
A fair question to ask, is, "how good is gross margin % for SCTY relative to peers?" In the chatrt below, we can see market cap on the x-axis and gross margin % on the y-axis. SCTY's gross margin % is the best of all peers.
Revenue vs. Operating Revenue / Operating Expense
This is my favorite measure. We can see that while operating revenue generated for every $1 in operating expenses has fallen and now found a steady state (the red line), it is right at $0.50. That's atrocious...
In English, SCTY earnings $0.50 in revenue for every $1 it spends in expenses. This measure may be the single most important metric in the earnings release after revenue and revenue forecasts.

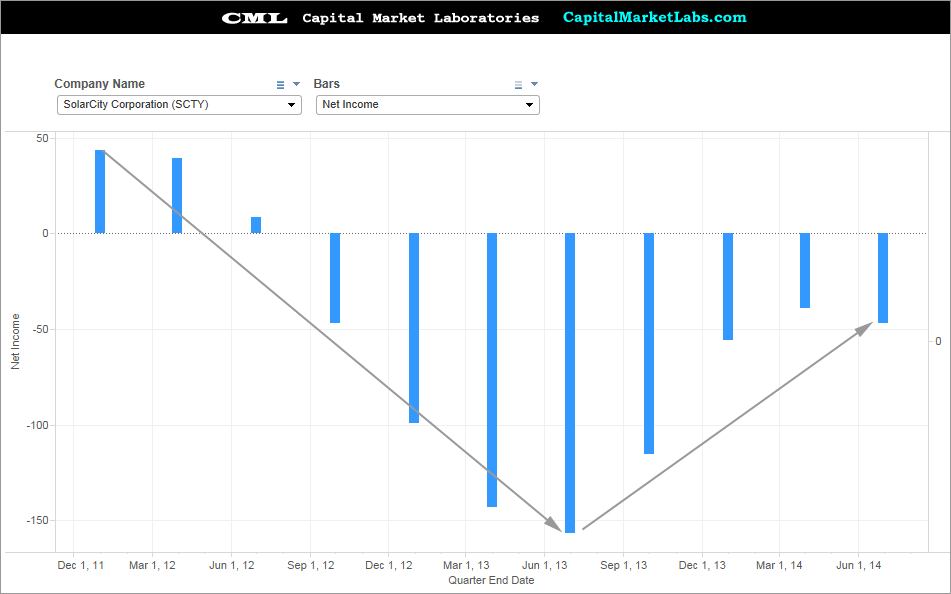
Net Income (TTM)
The chart directly above this one means net income is negative and ugly... and here we go: Net Income is negative and ugly. I do note a substantial improvement from the lows of a $155M loss (in a twelve-month-period), but in any case, that ratio in the prior chart is terrible and must improve for SCTY to be viable.
Valuation: Revenue vs Price to Sales vs. Peers
SCTY has a huge amount of risk in its equity price (IMHO) simply because the equity market is pricing it like no other solar company. It has very small revenue (x-axis) relative to peers but by far the highest price to sales (y-axis).
SCTY better show strong revenue growth and strong forecasts for future quarters or the stock could spasm down. Alternatively, if the company does show better revenue and forecasts for the future, and even, dare i say, a path to profitability, the stock could explode higher.

Now let's turn to risk pricing and the IV30™ chart in isolation, below.
Provided by Livevol
The implied volatility is the forward looking risk in the equity price as reflected by the option market (IV30™ looks forward exactly 30 calendar days).
In English, the red curve is the risk in future stock price movement. the blue "E" icons represent earnings dates and we can see that the risk into this earnings release is lower than any before it. That seems... weird.. to me...
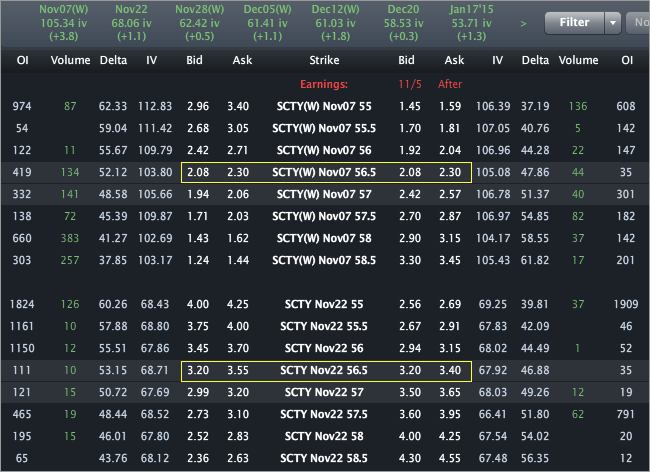
Finally, the Options Tab is included below.
Provided by Livevol
Using the at-the-money (ATM) straddle we can see that the option market reflects a price range of [$52, $61] by the end of trading on November 7th.
Using the Nov monthly options, expiring on November 21st, we can see a price range of [$50, $63].
- If you believe the stock will be outside that range on expiry or any date before then, then you think the volatility is too low.
- If you believe that range is too wide, and that the stock will definitively be in that range on expiration, then you think volatility is too high.
- If you're not sure, and can make an argument for either case, then you think volatility is priced just about right.
This is trade analysis, not a recommendation.
Follow @OphirGottlieb
Tweet
Legal Stuff:
Options involve risk. Prior to buying or selling an option, an investor must receive a copy of Characteristics and Risks of Standardized Options. Investors need a broker to trade options, and must meet suitability requirements.
The information contained on this site is provided for general informational purposes, as a convenience to the readers. The materials are not a substitute for obtaining professional advice from a qualified person, firm or corporation. Consult the appropriate professional advisor for more complete and current information. I am not engaged in rendering any legal or professional services by placing these general informational materials on this website.
I specifically disclaim any liability, whether based in contract, tort, strict liability or otherwise, for any direct, indirect, incidental, consequential, or special damages arising out of or in any way connected with access to or use of the site, even if I have been advised of the possibility of such damages, including liability in connection with mistakes or omissions in, or delays in transmission of, information to or from the user, interruptions in telecommunications connections to the site or viruses.
I make no representations or warranties about the accuracy or completeness of the information contained on this website. Any links provided to other server sites are offered as a matter of convenience and in no way are meant to imply that I endorse, sponsor, promote or am affiliated with the owners of or participants in those sites, or endorse any information contained on those sites, unless expressly stated.


No comments:
Post a Comment