| Tweet | Follow @OphirGottlieb |  |  |


This visualization is provided by:
Make These Visualizations Yourself: Free Trial
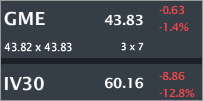
GME is trading $43.83, down 1.4% with IV30™ down 12.8%. The Symbol Summary is included below.
Provided by Livevol
Conclusion
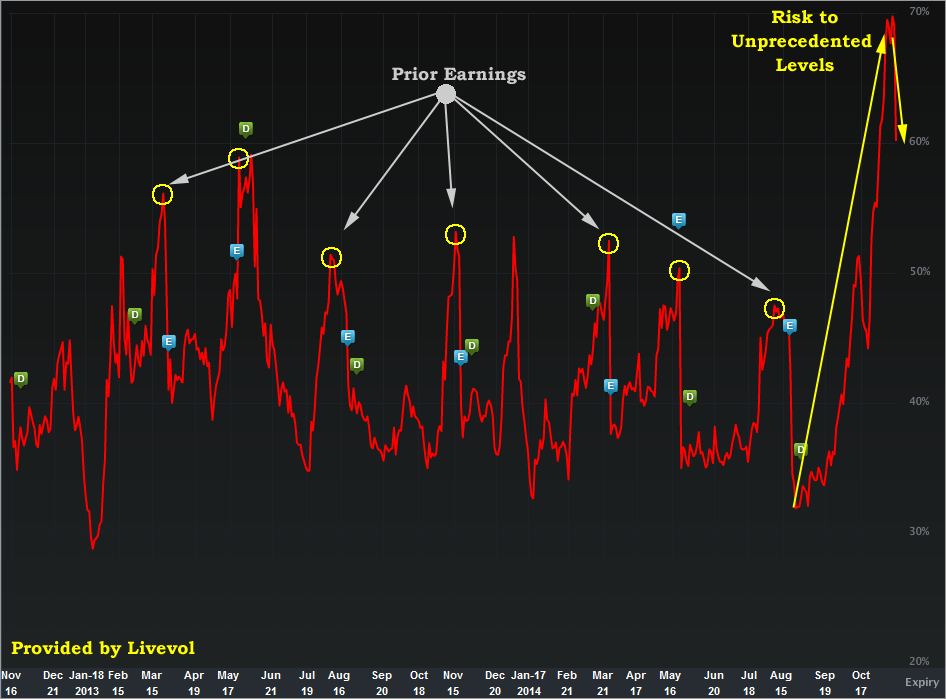
Even with a volatility dive today, GME is sitting an essentially unprecedented risk levels ahead of earnings due out on 11-20-14 after the market closes.
Even more compelling is that I will walk us through some fundamental measures that are all interesting, but not at all outliers.
So what?... So the risk in GME is not about past performance, it's all about the future and the unknowns it holds... like WMT now selling used video games... Yikes. Or the XBOX selling so poorly after initial release that GME (and other re-sellers) had to offer massive discounts and that became a problem, because, you guessed it, WMT will discount anyone to death.
Just released today were the total video game sales growth year-over-year:
---
Total video game sales came in at $790.7 million, about flat vs. last year. Video-game hardware sales were $273.5 million, +59% year-over-year. However that is a slow down from the +136% year-over-year growth last month. Console video-game software sales were -27% year-over-year to $350.3 million
Source: October 2014 U.S. Video-game Sales Results:, via Tae Kim's Tumblr.
---
Before we get to the fundamental measures, let's turn to the option market and risk. The IV30™ chart in isolation is included below.
Provided by Livevol

The implied volatility is the forward looking risk in the equity price as reflected by the option market (IV30™ looks forward exactly 30 calendar days).
In English, the red curve is the risk in future stock price movement. The blue "E" icons represent past earnings dates and as we can see, all of the levels of risk into those earnings are well below the current risk. Right or wrong, bull or bear, the option market is screaming risk in GME right now.
Now, let's turn to the financial measures.
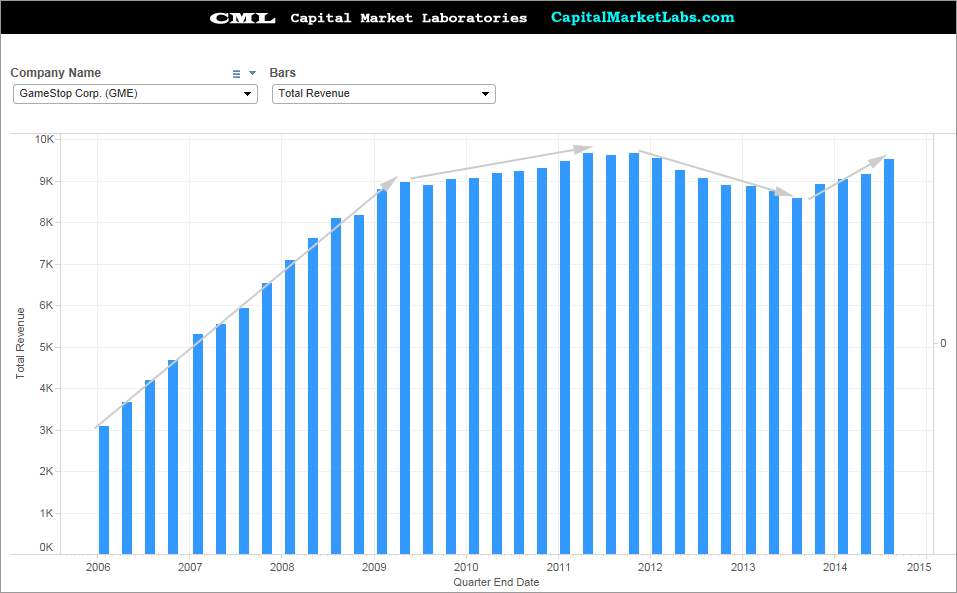
Revenue (TTM)
GME saw huge rise in revenue as a younger firm growing from $3B in revenue in 2006 to over $9B in 2008. Since then, however, revenue has reached a sort of equilibrium, which is not a good trend.
Provided by Capital Market Laboratories
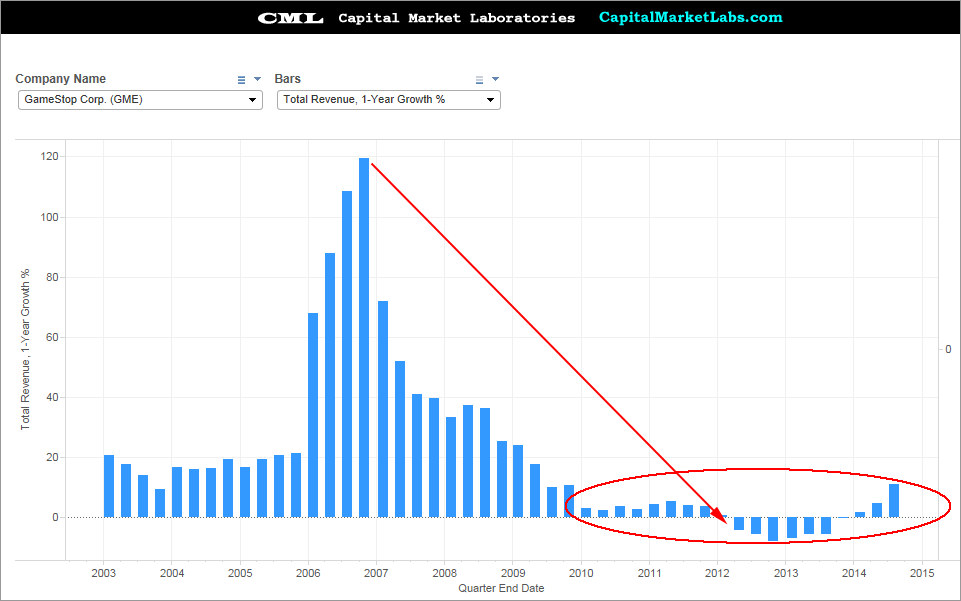
Revenue Growth (TTM)
This is an explicit image showing the year-over-year growth in revenue for GME, We can see the huge spike, the huge drop, and the relative quiet of late.
Provided by Capital Market Laboratories
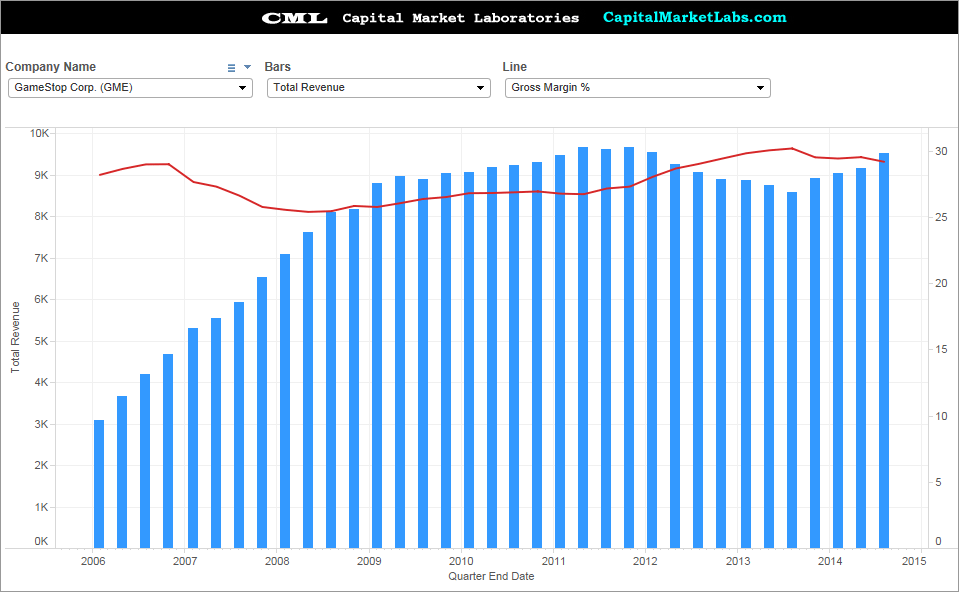
Revenue (TTM) vs Gross Margin %
This is the same chart as the first, but I have added gross margin % as a red line overlapped on the revenue. The rise in gross margin % and the overall consistency is excellent for GME -- so management is holding it together as revenue growth has essentially evaporated.
Provided by Capital Market Laboratories
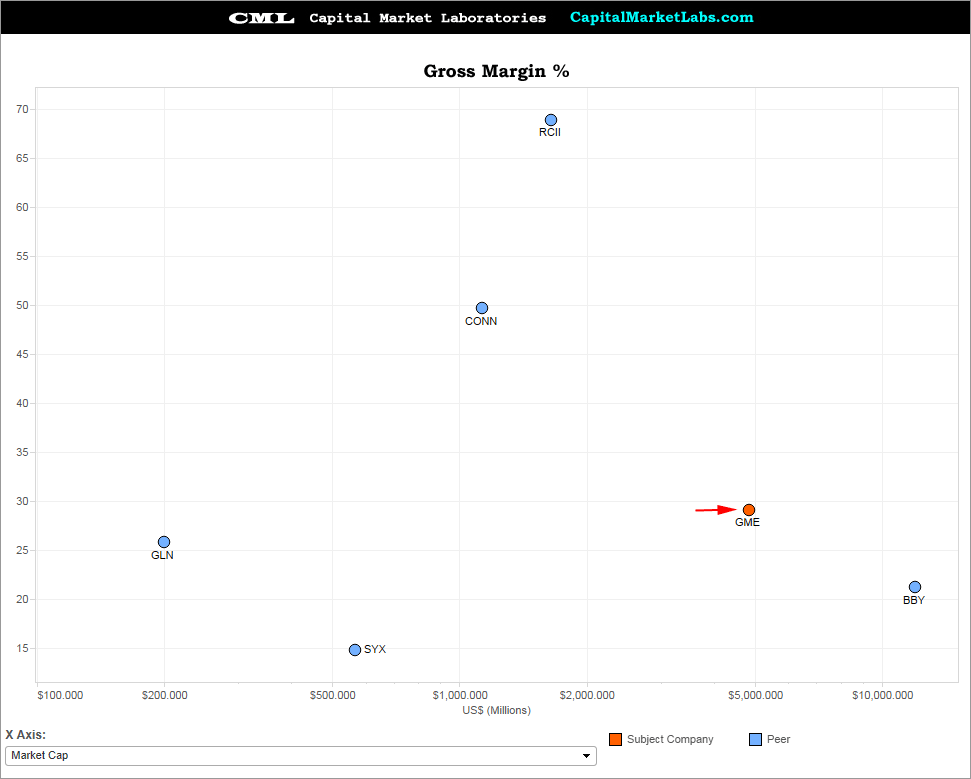
Gross Margin % vs Peers
We can see that gross margin % for GME is pretty much in the middle of the road for the peer group. Again, given the sales growth stall, it's not the worst thing in the world to see gross margin% still be competitive.
Provided by Capital Market Laboratories
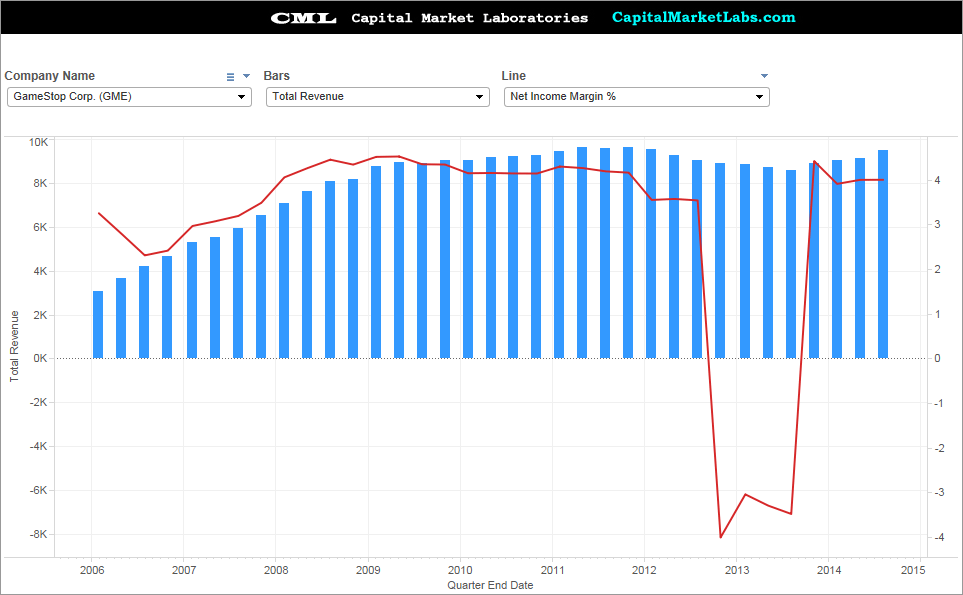
Revenue (TTM) vs Net Income Margin % (TTM)
Other than that wild blip down in earnings in 2013, net income margin % overall has remained very consistent. GME has not tried anything totally insane (not for a long period of time, anyway) in order to boost sales. What the company really needs is revenue growth -- the rest is "OK."
Provided by Capital Market Laboratories
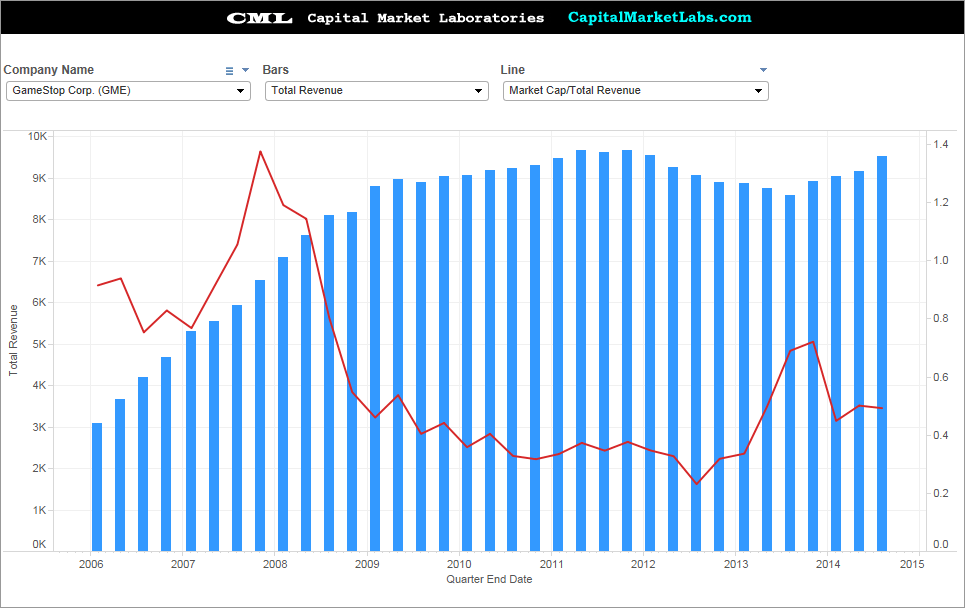
Revenue (TTM) vs. Price to Sales
This time we have price to sales as the red line overlapping the revenue bars. It's a wonderful presentation of how the forward looking equity valuation (price to sales) dipped massively just as GME revenue stopped growing.
Provided by Capital Market Laboratories
So that's the deal with GME in terms of financials. The firm is stuck with revenue growth while it has maintained its margins. Now let's turn to the explicit risk pricing by the option market.
Finally, the Options Tab is included below.
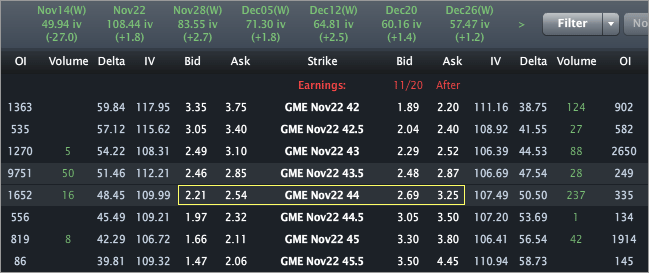
Provided by Livevol
Using the at-the-money (ATM) straddle we can see that the option market reflects a price range of [$39.50, $49.50] by the end of trading on November 21st.
- If you believe the stock will be outside that range on expiry or any date before then, then you think the volatility is too low.
- If you believe that range is too wide, and that the stock will definitively be in that range on expiration, then you think volatility is too high.
- If you're not sure, and can make an argument for either case, then you think volatility is priced just about right.
This is trade analysis, not a recommendation.
Follow @OphirGottlieb
Tweet
Legal Stuff:
Options involve risk. Prior to buying or selling an option, an investor must receive a copy of Characteristics and Risks of Standardized Options. Investors need a broker to trade options, and must meet suitability requirements.
The information contained on this site is provided for general informational purposes, as a convenience to the readers. The materials are not a substitute for obtaining professional advice from a qualified person, firm or corporation. Consult the appropriate professional advisor for more complete and current information. I am not engaged in rendering any legal or professional services by placing these general informational materials on this website.
I specifically disclaim any liability, whether based in contract, tort, strict liability or otherwise, for any direct, indirect, incidental, consequential, or special damages arising out of or in any way connected with access to or use of the site, even if I have been advised of the possibility of such damages, including liability in connection with mistakes or omissions in, or delays in transmission of, information to or from the user, interruptions in telecommunications connections to the site or viruses.
I make no representations or warranties about the accuracy or completeness of the information contained on this website. Any links provided to other server sites are offered as a matter of convenience and in no way are meant to imply that I endorse, sponsor, promote or am affiliated with the owners of or participants in those sites, or endorse any information contained on those sites, unless expressly stated.


No comments:
Post a Comment