| Tweet | Follow @OphirGottlieb |  |  |

This visualization is provided by:
Make These Visualizations Yourself: Free Trial
KNDI is trading $17.17, up 5.1% with IV30™ up 5.6%. The Symbol Summary is included below.
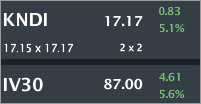
Provided by Livevol

Recent News: Kandi Launches Car-Share Mobile Payment Via Alibaba at Investor's Business
Conclusion
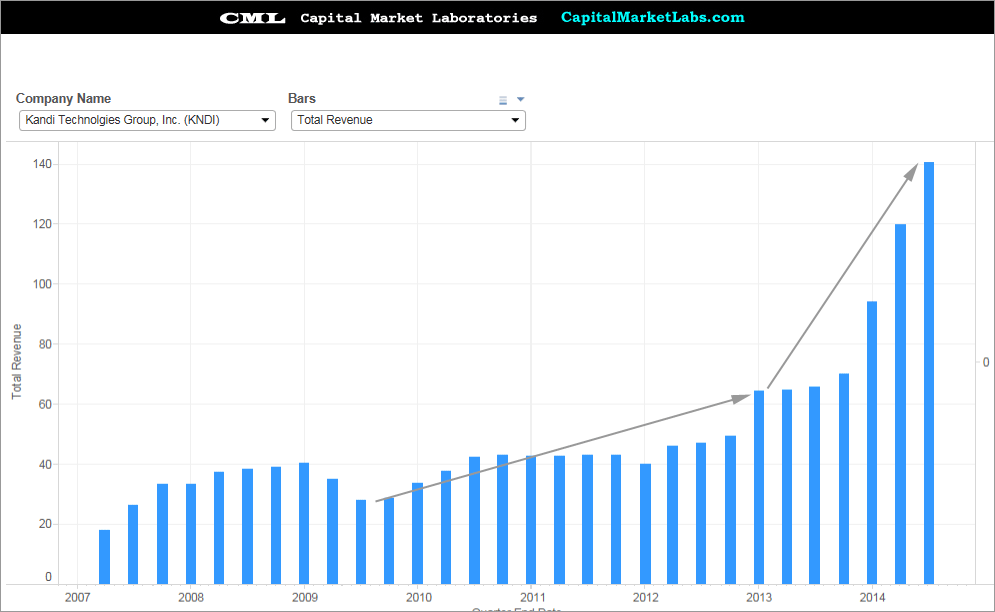
KNDI has booming revenue, collapsing earnings and a huge price to sales ratio. The question is, what's driving the losses and is it "a growth story" or is it a "losing story?" In short, when earnings come out KNDI must show increasing revenue (and positive forecasts), a steadying of gross margin % and a cler plan of how and when to control selling expenses (which are booming right now).
Now let's turn to the financial measures.
Total Revenue (TTM)
Up from $20M to now over $140M (trailing-twelve-months), in the last five-years. This is the growth story.
Provided by Capital Market Laboratories
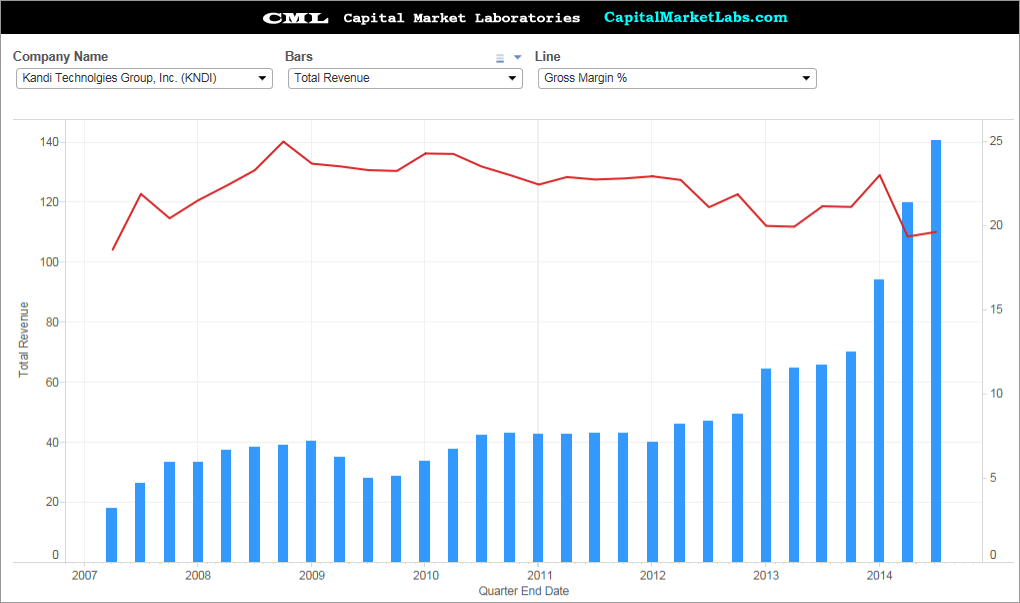
Revenue (TTM) vs. Gross Margin %
When a young firm grows revenue quickly, the next step I always take is to measure gross margin % trend. KNDI does seem to have found an equilibrium at about 20%. I do note the peak of 25% a few years ago. When earnings come out in a a couple of weeks, this will be a huge measure to watch. Gross margin % must stabilize.
Provided by Capital Market Laboratories
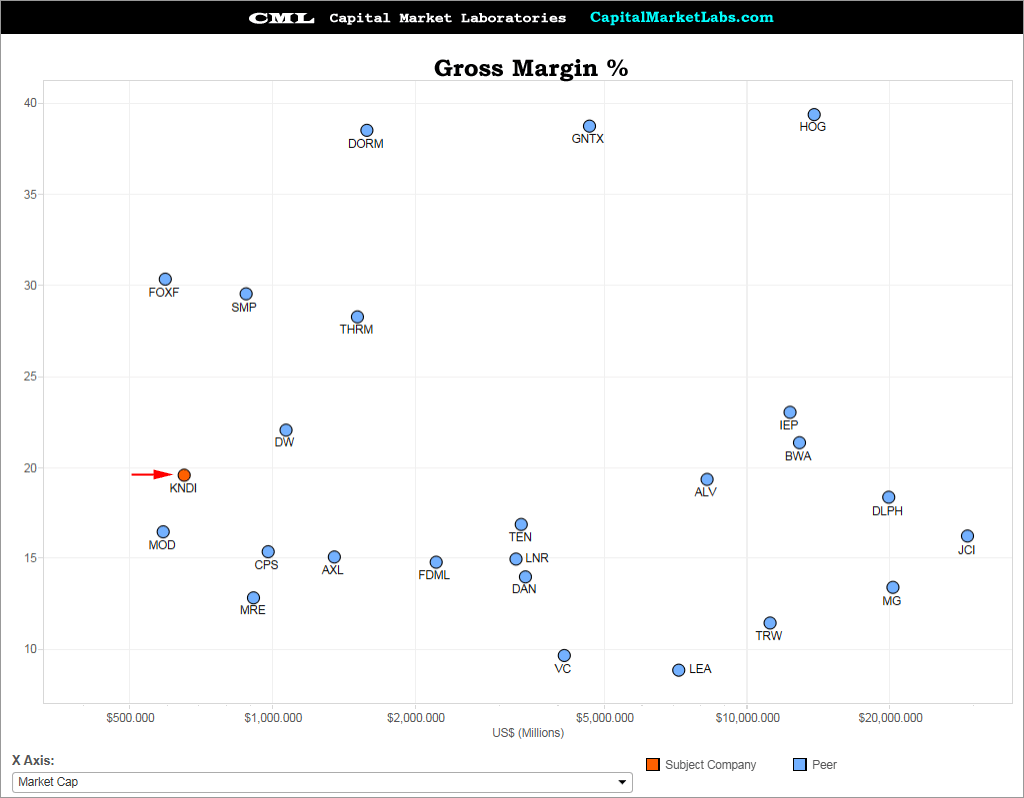
Gross Margin % vs. Peers
For sake of a broader picture, I have plotted KNDI's gross margin% vs its peers.The measure is low, but by no means an outlier.
Provided by Capital Market Laboratories
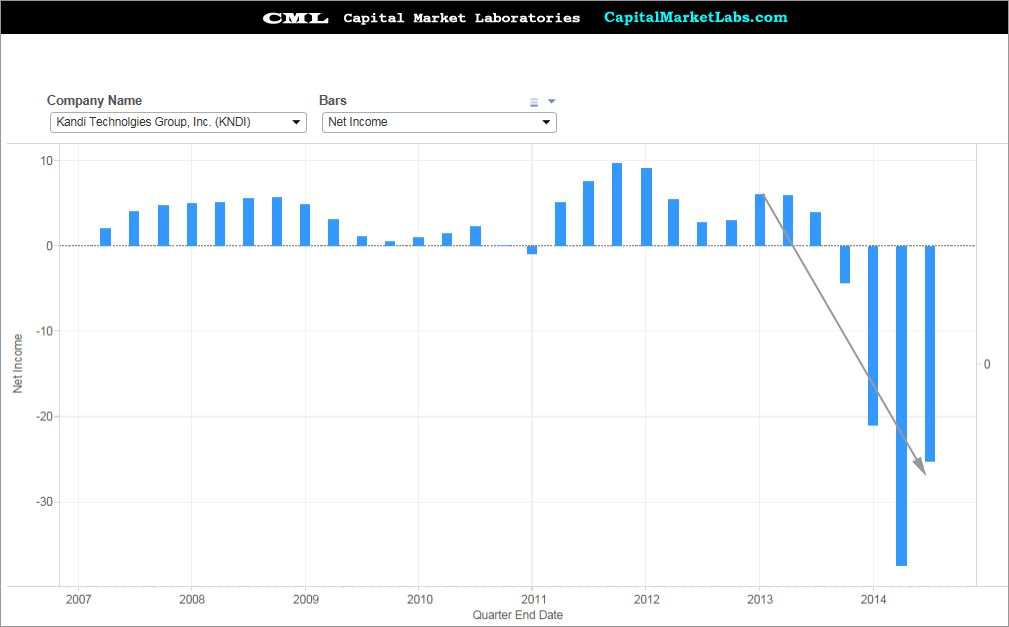
Net Income (TTM)
Well, earnings have plummeted of late. I do note one critical observation -- these are all small numbers and there was a turn around last quarter.
Provided by Capital Market Laboratories
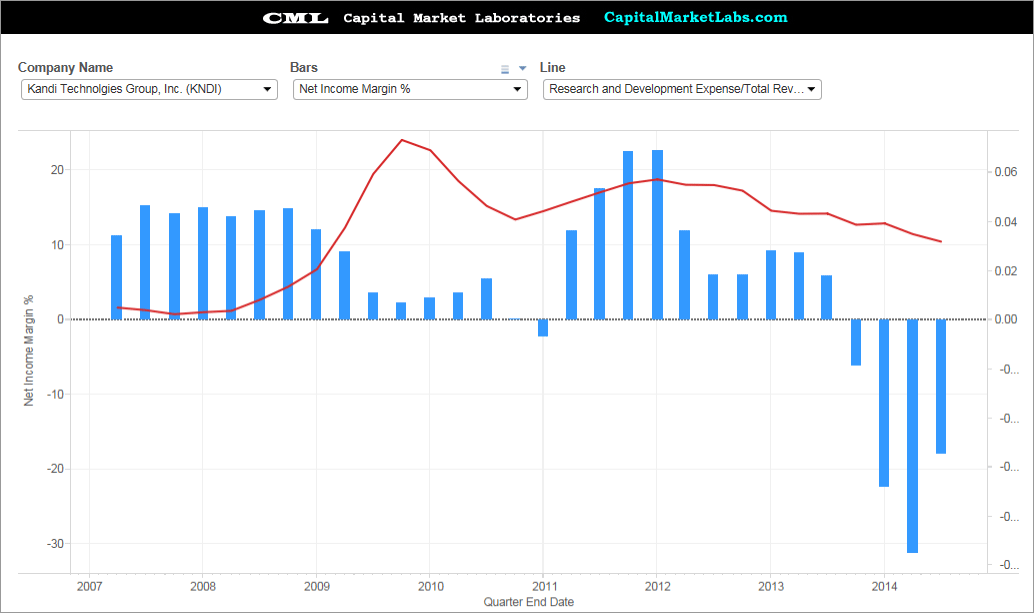
Net Income Margin % vs. R&D per Dollar of Revenue
So, let's figure out where net income losses are coming from. If we look at R&D spent for every $1 in revenue, we can actually see a decline. That implies two things:
(1) Net income worsening is not due to investment in R&D.
(2) KNDI is turning away (a little) from R&D at the moment.
Provided by Capital Market Laboratories
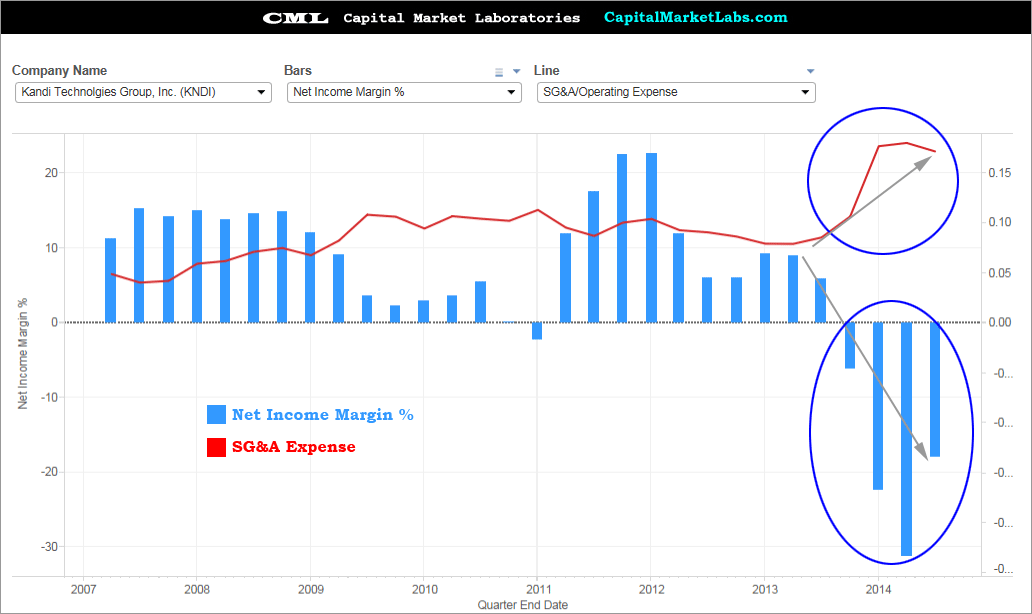
Net Income Margin % vs. SG&A Expense / Operating Expense
It's hardly a needle in a haystack, but if we're looking for what's driving net income margin % down, it's simply an increase in selling, general & administrative expense. This is actually a very normal place to see expenses increases in a young firm and, of all places to see driving losses, this isn't the "worst." Much like R&D, it's an investment in branding and selling.
Provided by Capital Market Laboratories
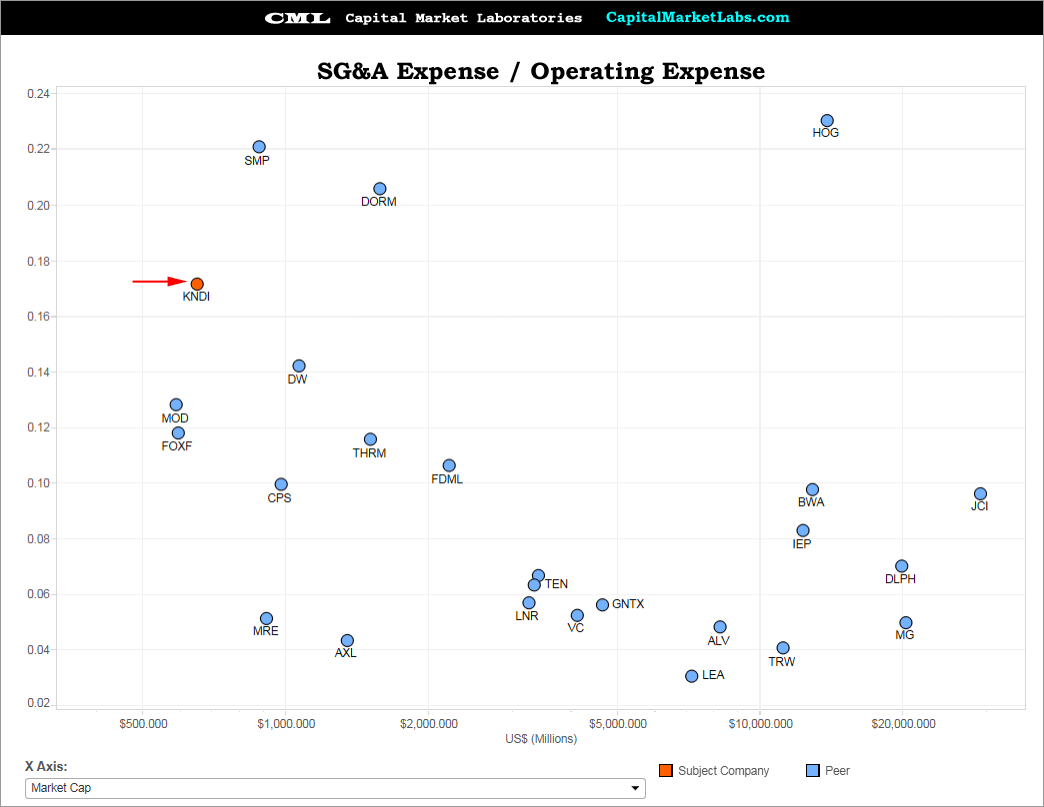
SG&A Expense / Operating Expense vs. Peers
How high is KNDI SG&A expense relative to peers?... High, but not "outlier" high. The last two charts taken together at the very least paint a clearer picture of where the revenue is being spent.
Provided by Capital Market Laboratories
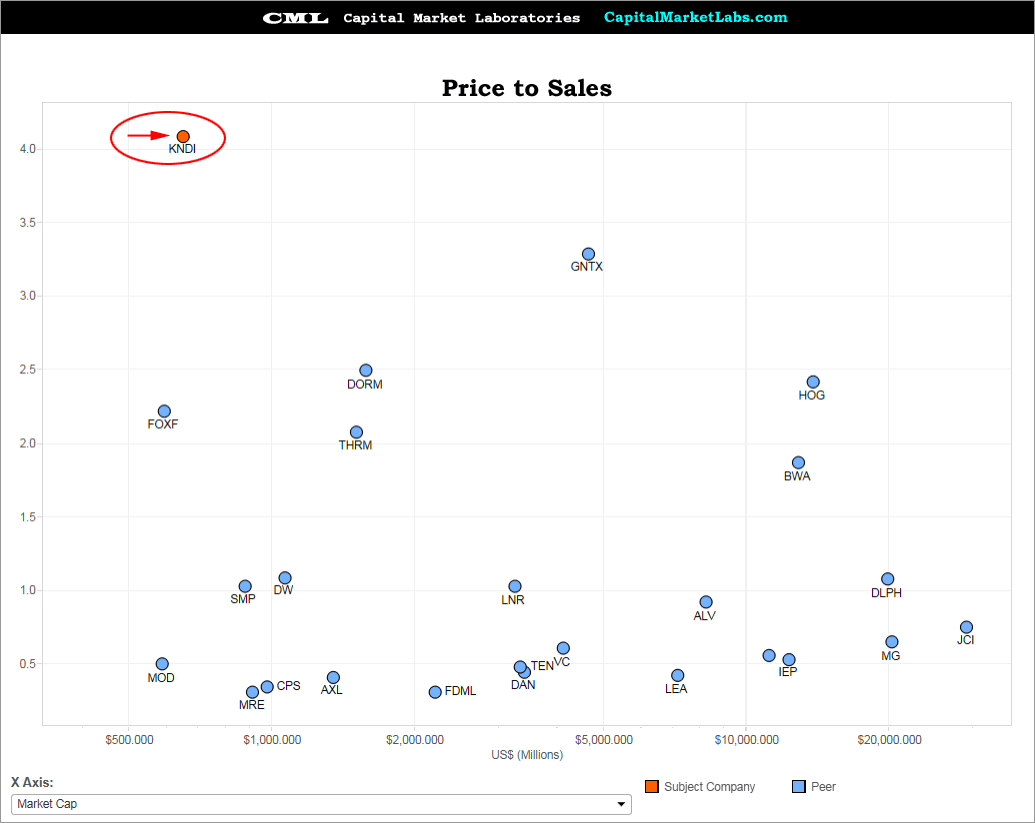
Price to Sales vs Peers
Everything to this point has been about KNDI the company. This next chart is about KNDI the stock. KNDI has by far the highest price to sales valuation which is simply a reflection by the equity market of high expectations. So, this is a glass "half full" or "half empty," depending on your assessment of the company's future.
Provided by Capital Market Laboratories
This is trade analysis, not a recommendation.
Follow @OphirGottlieb
Tweet
Legal Stuff:
Options involve risk. Prior to buying or selling an option, an investor must receive a copy of Characteristics and Risks of Standardized Options. Investors need a broker to trade options, and must meet suitability requirements.
The information contained on this site is provided for general informational purposes, as a convenience to the readers. The materials are not a substitute for obtaining professional advice from a qualified person, firm or corporation. Consult the appropriate professional advisor for more complete and current information. I am not engaged in rendering any legal or professional services by placing these general informational materials on this website.
I specifically disclaim any liability, whether based in contract, tort, strict liability or otherwise, for any direct, indirect, incidental, consequential, or special damages arising out of or in any way connected with access to or use of the site, even if I have been advised of the possibility of such damages, including liability in connection with mistakes or omissions in, or delays in transmission of, information to or from the user, interruptions in telecommunications connections to the site or viruses.
I make no representations or warranties about the accuracy or completeness of the information contained on this website. Any links provided to other server sites are offered as a matter of convenience and in no way are meant to imply that I endorse, sponsor, promote or am affiliated with the owners of or participants in those sites, or endorse any information contained on those sites, unless expressly stated.


No comments:
Post a Comment