

| Tweet | Follow @OphirGottlieb |  |  |

This visualization is provided by:
Make These Visualizations Yourself: Free Trial
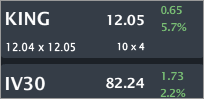
KING is trading $12.05, up 5.7% with IV30™ up 2.2%. The Symbol Summary is included below.
Provided by Livevol
King Digital Entertainment plc is an interactive entertainment company. The Company’s games include Candy Crush Saga, Pet Rescue Saga, Farm Heroes Saga, Papa Pear Saga and Bubble Witch Saga.
Conclusion
KING has earnings due out 11-6-2014 after the market closes. The risk as reflected by the option market is higher for this earnings release than any of the prior two, though they are all very close.
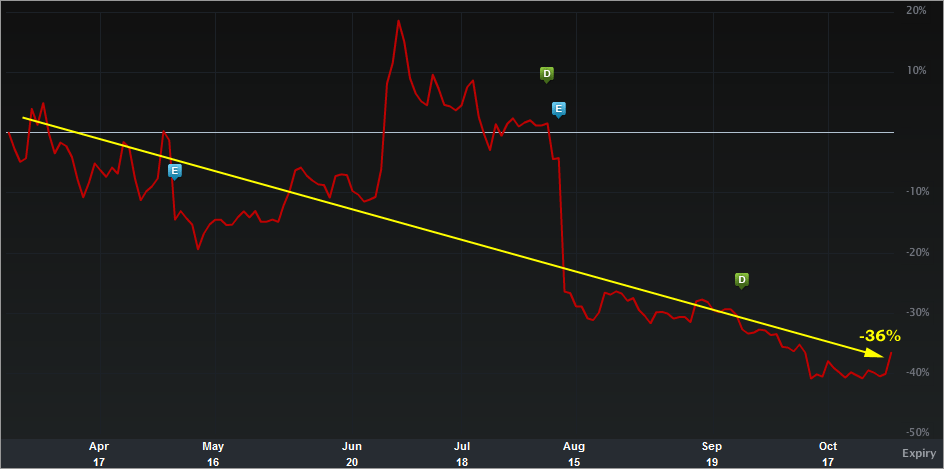
More interestingly, the company has has incredible financial success, yet there is so much doubt and risk about the future, that the stunning charts I'm about to show you have resulted in nothing other than a stock down 36% since IPO.
Let's start with the all-time stock return chart.
Provided by Livevol
So there you go... down 36%. Now let's turn to the financial measures which will blow your mind (or.. they did mine).
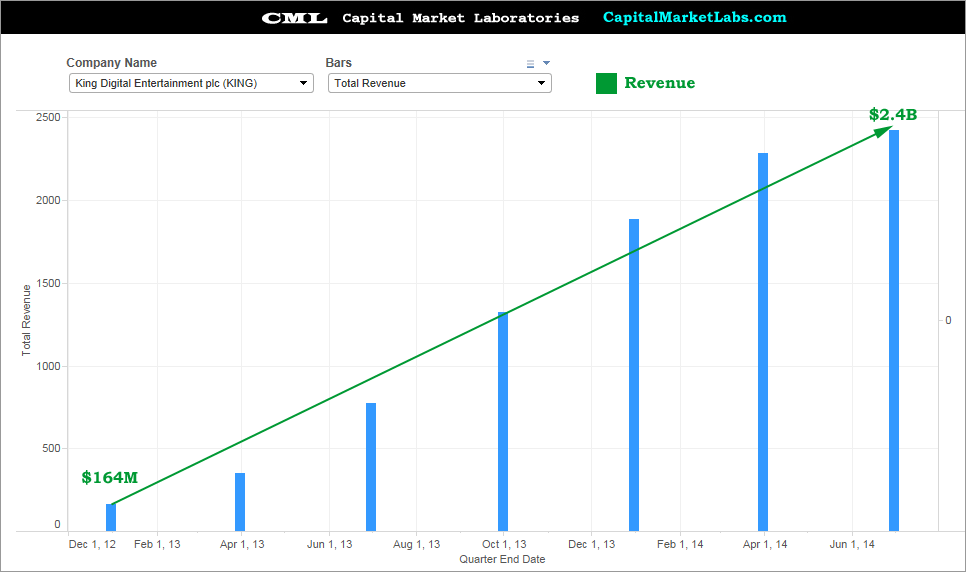
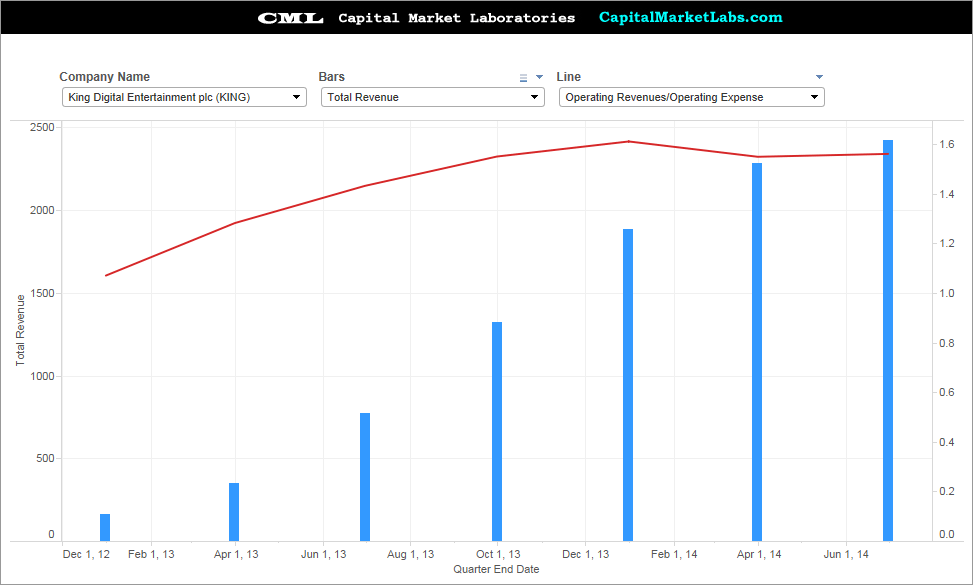
Revenue (TTM)
KING revenue has risen from $164M to $2.4B in a matter of two-years. Wow...
---> Make These Visualizations Yourself: Free Trial
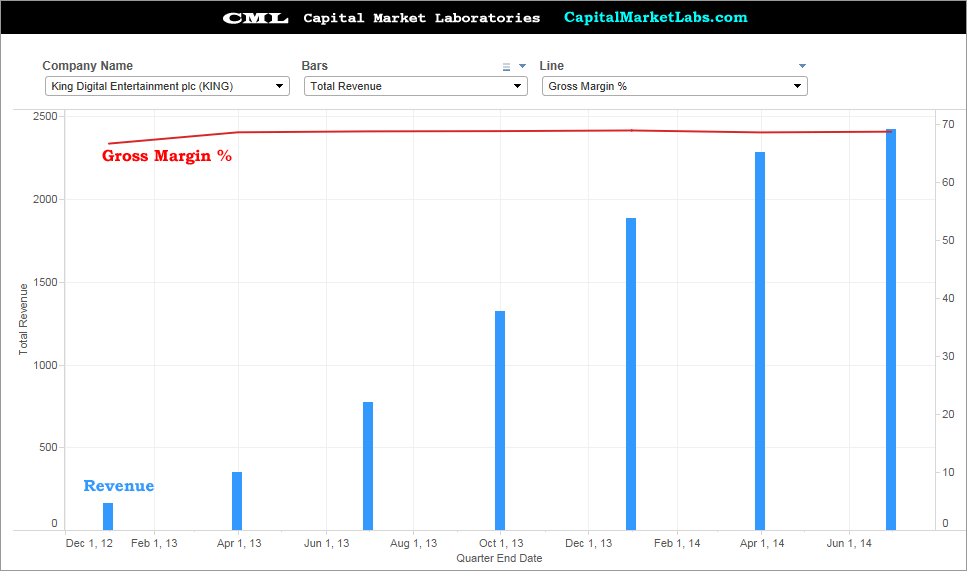
Revenue vs. Gross Margin %
As a technology firm grows revenue, especially this fast, we want to watch that gross margin % doesn't deteriorate. For KING, we can see it hasn't deteriorated at all. A remarkably consistent gross margin % as revenue has increased more than 10-fold.
Operating Revenue / Operating Expense
this measure sounds complicated, but it's really simple: This tells us how many dollars in revenue the firm earns for every dollar in expenses. This number must be above 1 (at least) for a firm to be profitable, and for KING, it is both above 1 and growing. This is a very good result for KING.
---> Make These Visualizations Yourself: Free Trial
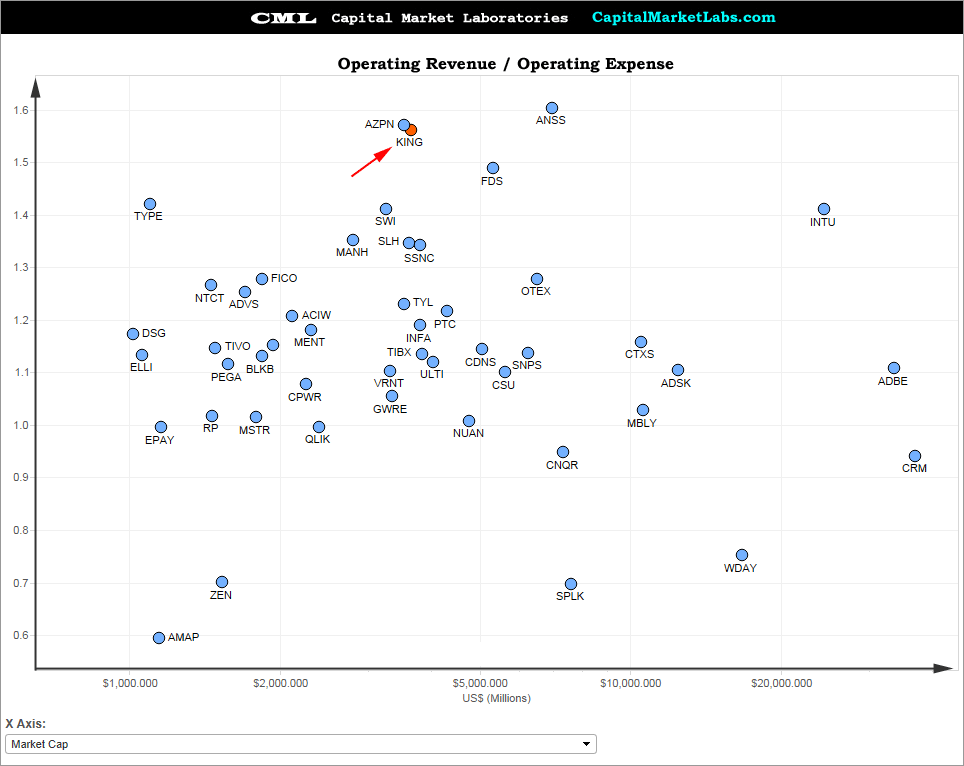
Operating Revenue / Operating Expense vs. Peers
How good is the measure for KINg?... Well, relative to its peers above $1B in market cap, it's in the 96% percentile... or in English, it's a really high margin relative to peers.
Earnings and Revenue Growth
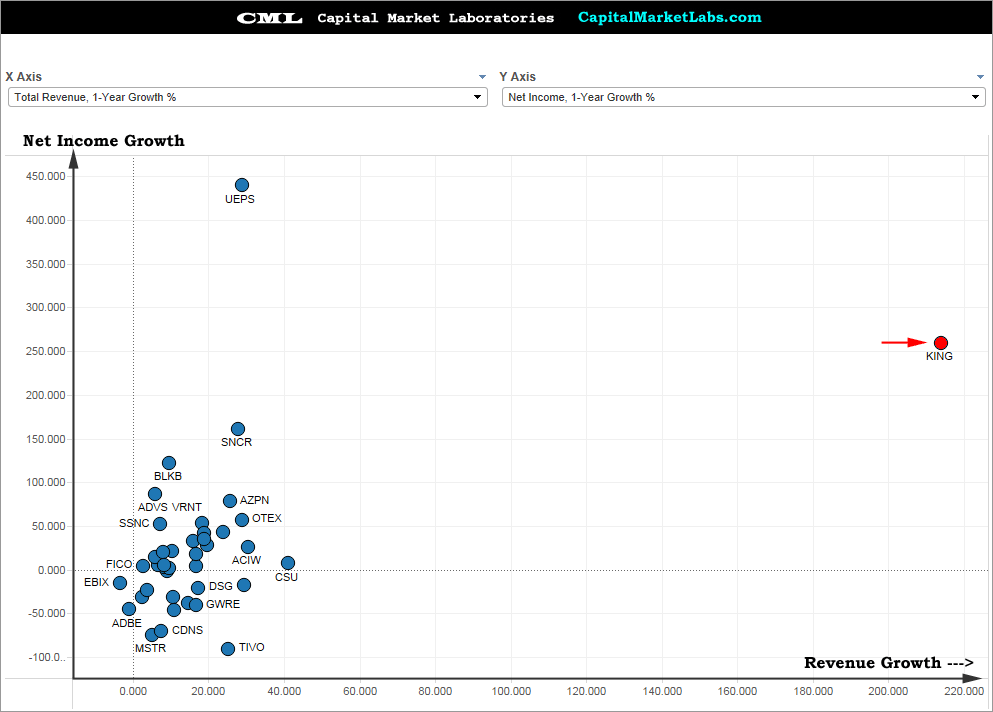
If we plot net income, 1-year growth on the y-axis and revenue, 1-year growth on the x-axis, we can see KING is simply on a different planet than its peers. It basically needs a different set of axes... remarkable.
---> Make These Visualizations Yourself: Free Trial
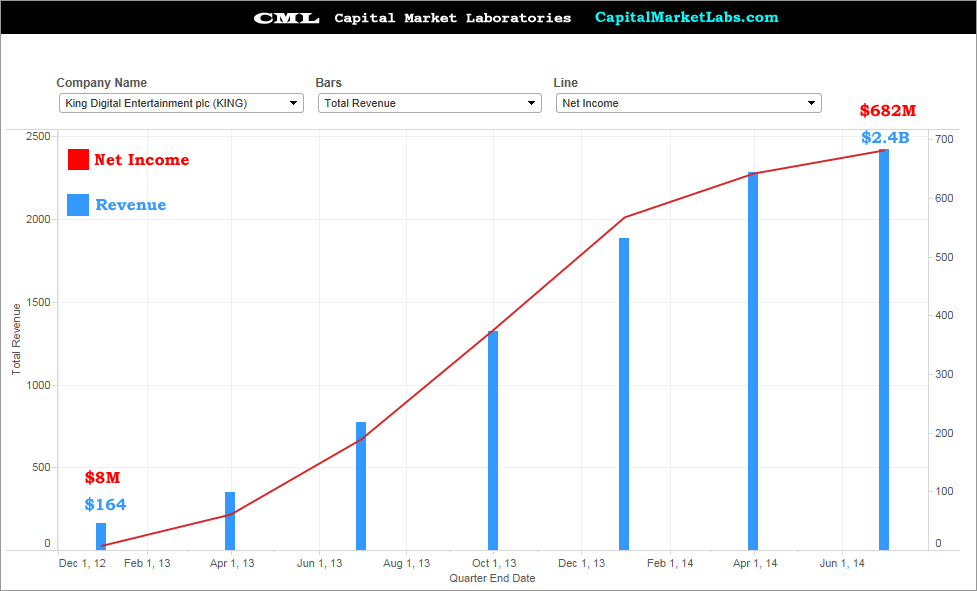
Revenue (TTM) vs Net Income (TTM)
So all of the above brings us to the final chart surrounding earnings... namely, the blue bars are revenue and the red line is net income. KING has not only grown revenue ~14x, it has grown earnings ~80x. I mean, those are crazy numbers...
---> Make These Visualizations Yourself: Free Trial
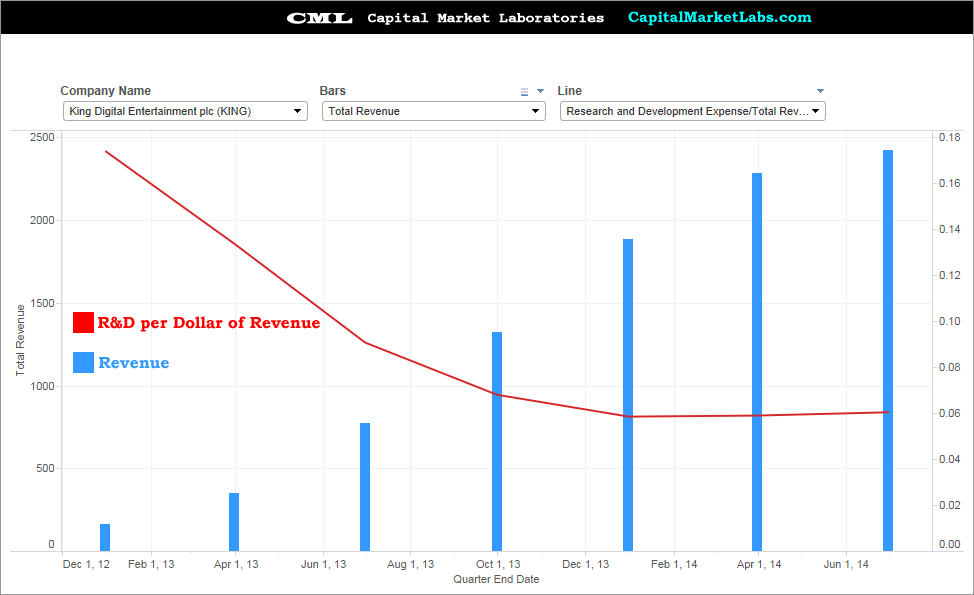
Research & Development per Dollar of Revenue
We have revenue as the blue bars and R&D per dollar of revenue in the red line. We can see a decidedly downward sloping trend in R&D for a couple of years, and now a very consistent equilibrium point of about $0.06 spent on R&D for every $1 generated in revenue.
All of those incredible numbers have resulted in... a stock down 36%... that speaks to the risk of the business and the lack of forward looking clarity. Video games and apps are almost impossible to predict in terms of future success and that's what we see with KING.
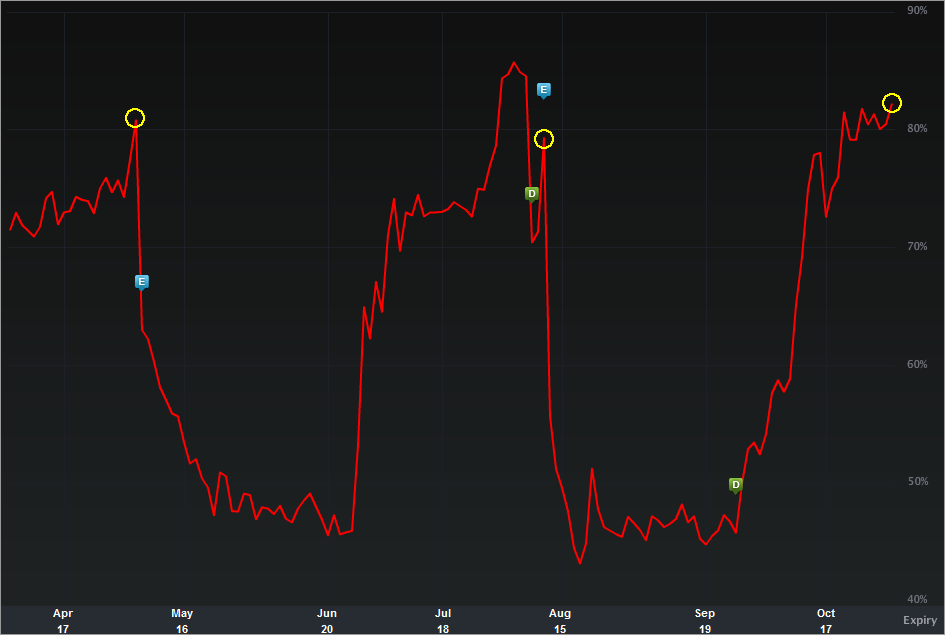
Now it's risk time... so let's turn to the IV30™ chart in isolation, below.
Provided by Livevol
The implied volatility is the forward looking risk in the equity price as reflected by the option market (IV30™ looks forward exactly 30 calendar days).
In English, the red curve is the risk in future stock price movement. the blue "E" icons represent prior earnings dates. We can see the risk into this earnings is above the prior two, but well within the realm of "normal"for this firm's history.
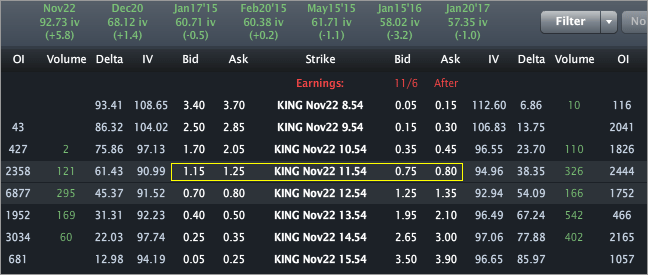
Finally, the Options Tab is included below.
Provided by Livevol
Using the at-the-money (ATM) straddle we can see that the option market reflects a price range of [$9.54, $13.54] by the end of trading on Nov. 21st.
- If you believe the stock will be outside that range on expiry or any date before then, then you think the volatility is too low.
- If you believe that range is too wide, and that the stock will definitively be in that range on expiration, then you think volatility is too high.
- If you're not sure, and can make an argument for either case, then you think volatility is priced just about right.
This is trade analysis, not a recommendation.
Follow @OphirGottlieb
Tweet
Legal Stuff:
Options involve risk. Prior to buying or selling an option, an investor must receive a copy of Characteristics and Risks of Standardized Options. Investors need a broker to trade options, and must meet suitability requirements.
The information contained on this site is provided for general informational purposes, as a convenience to the readers. The materials are not a substitute for obtaining professional advice from a qualified person, firm or corporation. Consult the appropriate professional advisor for more complete and current information. I am not engaged in rendering any legal or professional services by placing these general informational materials on this website.
I specifically disclaim any liability, whether based in contract, tort, strict liability or otherwise, for any direct, indirect, incidental, consequential, or special damages arising out of or in any way connected with access to or use of the site, even if I have been advised of the possibility of such damages, including liability in connection with mistakes or omissions in, or delays in transmission of, information to or from the user, interruptions in telecommunications connections to the site or viruses.
I make no representations or warranties about the accuracy or completeness of the information contained on this website. Any links provided to other server sites are offered as a matter of convenience and in no way are meant to imply that I endorse, sponsor, promote or am affiliated with the owners of or participants in those sites, or endorse any information contained on those sites, unless expressly stated.
No comments:
Post a Comment